Fig. 1.
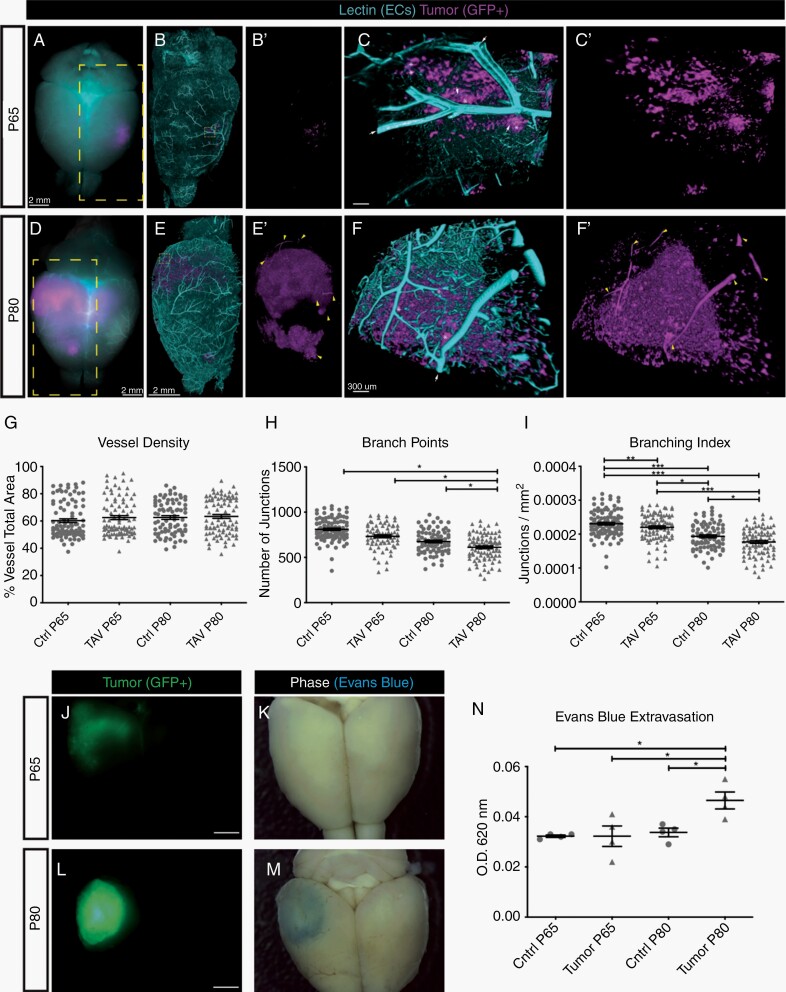
Progressive morphological and functional changes in tumor-associated vessels. (A,D) Whole-mount images of an intact mouse brain at P65 (A) or P80 (D), with tumor-derived cells labeled by GFP (magenta), and vessels labeled by fluorescent lectin (teal). The yellow boxed area in (A,D), after CLARITY-based tissue clearing and lightsheet confocal imaging, is magnified and shows (B,E) vessels and tumor together or (B′,E′) tumor alone. The yellow boxed area in (B,E) is magnified and shows (C,F) vessels and tumor and (C′,F′) tumor alone. White arrows denote vessels (teal) that are associated with tumors (magenta), denoted by asterisks. Yellow carets in (E′) denote GFP+ vessel-like tubes. Scale bar in A, B, B′, D, E, and E′ = 2 mM. Scale bar in C, C′, F, and F′ = 300 µm. (G-I) Quantification of vessel morphology at P65 and P80 for tumor-associated vasculature (TAV) and the contralateral non-tumor region. (J-M) Whole-mount and phase images show brain tumor progression from P65 (J, K) to P80 (L, M). Matching images of each brain following intravenous injection of Evans blue dye. (N) Quantification of Evans blue dye leak, as determined by the ratio of absorbance at OD620-405 nm per milligram of tissue from the tumor area of a contralateral region from the same brain.

