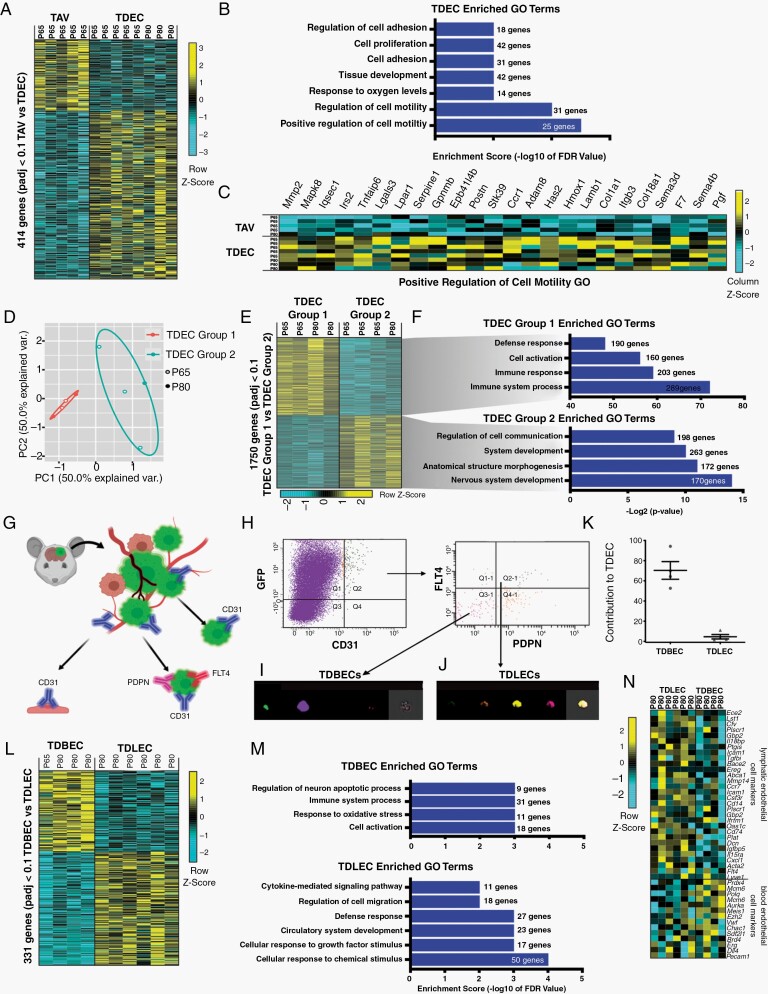
Fig. 5.
Murine glioma TDECs are comprised of molecularly and cellularly unique subpopulations. (A) Heatmap of differentially expressed genes in TAVs and TDECs. Genes enriched are indicated in yellow, genes depleted are turquoise. (B) Select gene ontology (GO) terms for genes up-regulated in TDEC populations are shown. (C) Heatmap showing individual genes for the GO category Positive Regulation of Cell Migration. (D) Principal component analysis of bulk RNA-Seq shows that TDEC transcriptomes segregate into 2 groups. (E) Heatmap of differentially expressed genes detected by RNA-seq shows Group 1 (n = 4) and Group 2 (n = 4) TDECs feature distinct signatures. (F) GO terms for select genes up-regulated in TDEC Group1 and Group 2 populations. (G) Schematic illustrating the strategy for isolating TDBECs from mouse glioma. (H) Representative FACS plots demonstrating the isolation of TDBEC and TDLEC populations. (I) Representative image stream analysis demonstrating expression of GFP and CD31 in TDBECs and (J) GFP, CD31, PDNP, and FLT4 in TDLECs. (K) Quantification of TDBECs and TDLECs to the total TDEC population. (L) A heatmap of differentially expressed genes in TDBECs and TDLECs. (M) Associated select GO terms for genes up-regulated in bulk tumor, TDBEC, or TDLEC populations. (N) Heatmap of select genes upregulated in murine blood lymphatic (TDLECs) versus blood endothelial cells (TDBECs).

