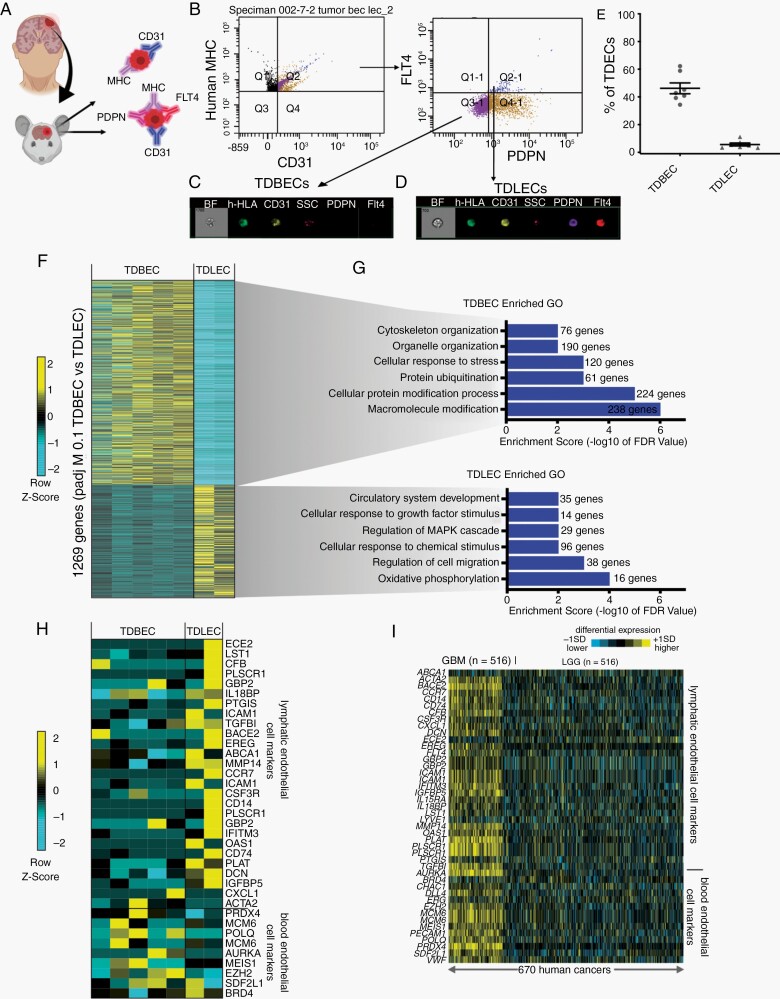
Fig. 6.
TDEC heterogeneity is conserved in a human xenograft model of glioma. (A) Schematic of TDBECs and TDLECs FACS isolation from PDOX model. (B) FACS plots demonstrating isolation of human TDBEC and TDLEC cell populations from PDOX. (C) Image stream analysis demonstrating protein expression of GFP and CD31 TDBECs. (D) Image stream analysis demonstrating expression of GFP, CD31, PDNP, and FLT4 TDLECs. (E) Quantification of TDBECs and TDLECs relative to the entire TDEC population. (F) Heatmap of differentially expressed genes in PDOX TDBECs and PDOX TDLECs. (G) Select GO terms up-regulated in either human TDLEC or human TDBEC populations. (H) Heatmap depicting conserved upregulation of lymphatic endothelial transcripts in PDOX TDLECs and blood endothelial transcripts in PDOX TDBECs. (I) Heatmap showing enrichment of blood endothelial cell and lymphatic transcripts in high-grade human glioma (n = 154) compared to low-grade glioma (LGC) (n = 516) as determined by RNA-seq data from TCGA.

