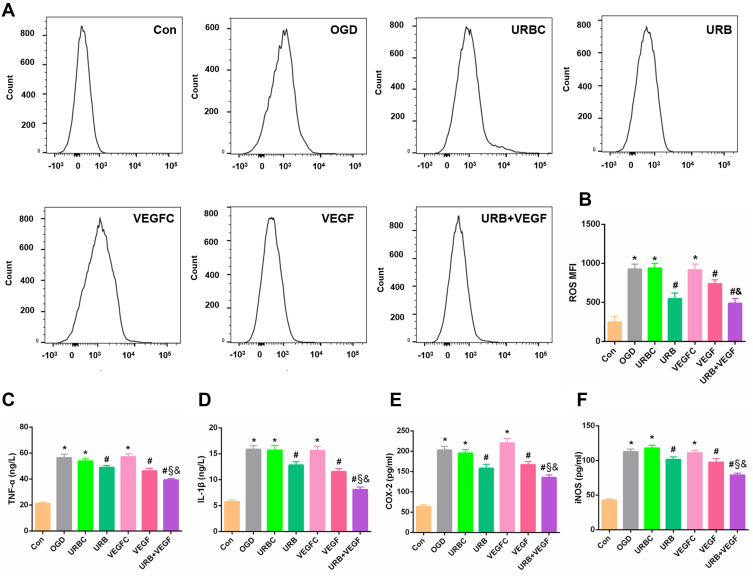
Figure 7.
Effects of VEGF-A NF membrane and URB597 on mitochondria ROS and inflammatory responses. (A) Representative histograms of flow cytometric evaluation of the cell-associated DCF-DA. (B) Quantitative analysis of cellular ROS levels. (C–F) Quantitative analysis of pro-inflammatory factors, such as TNF-α, IL-1β, COX-2, and iNOS. *P < 0.05 vs Con; #P < 0.05 vs OGD; §P < 0.05 vs URB; &P < 0.05 vs VEGF.

