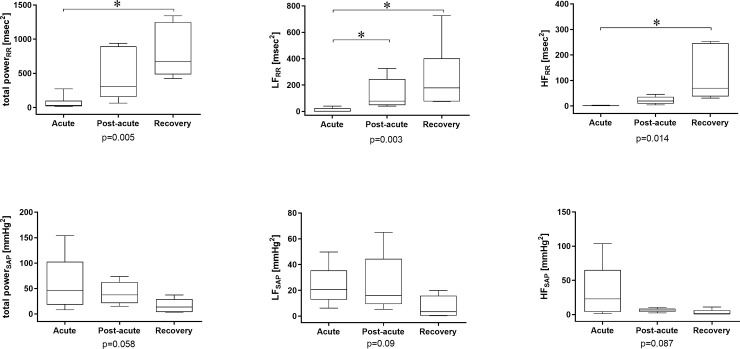
Fig 1. Heart Rate (RR) and Systolic Arterial Pressure (SAP) variability analysis results in the frequency domain.
RR, heart period; SAP, systolic arterial pressure; HF, high frequency band of the power spectrum; LF, low frequency band of the power spectrum. *p<0.05 for post-hoc analysis of ANOVA on ranks.

