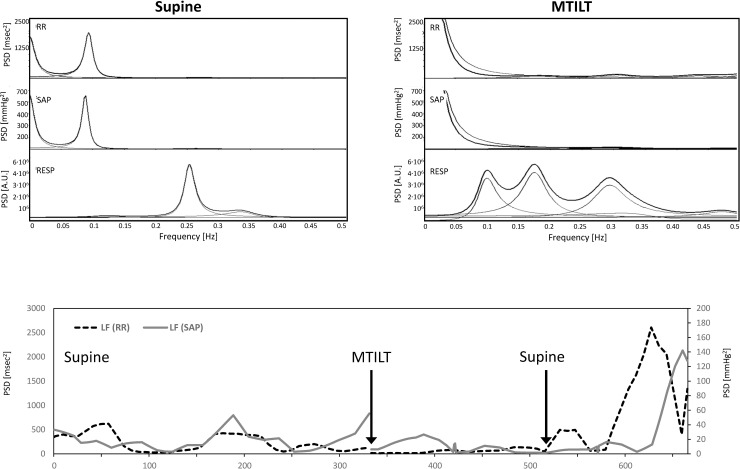
Fig 3. Graphical representation of heart period and systolic pressure variability of a patient admitted to ICU during the prodromal phase and passive modified tilt (MTILT).
At the top, the power spectra derived from 300 beats at baseline and during MTILT are shown. MTILT induced a marked reduction of LF spectral densities of heart period and SAP. At the bottom, the pattern of LF spectral densities of heart period and SAP changes assessed by wavelets analysis is shown. Both LF densities reappeared after the MTILT interruption. PSD, power spectral density.

