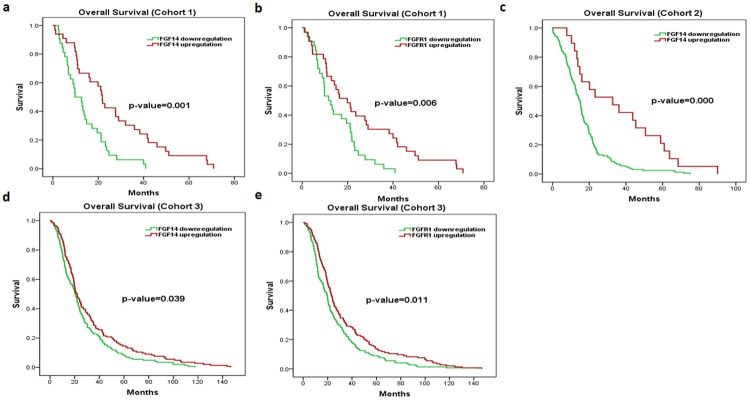
Fig 1. Kaplan–Meier survival analyses of FGF14 and FGFR1 in PDAC cohorts 1, 2 and 3.
Red represents expression ≥ the median, while green represents expression < the median. Overall survival plots of FGF14 (a), FGFR1 (b) in cohort 1. Overall survival plots of FGF14 (c) in cohort 2. Overall survival plots of FGF14 (d), FGFR1 (e) in cohort 3. (* p ≤ 0.05).

