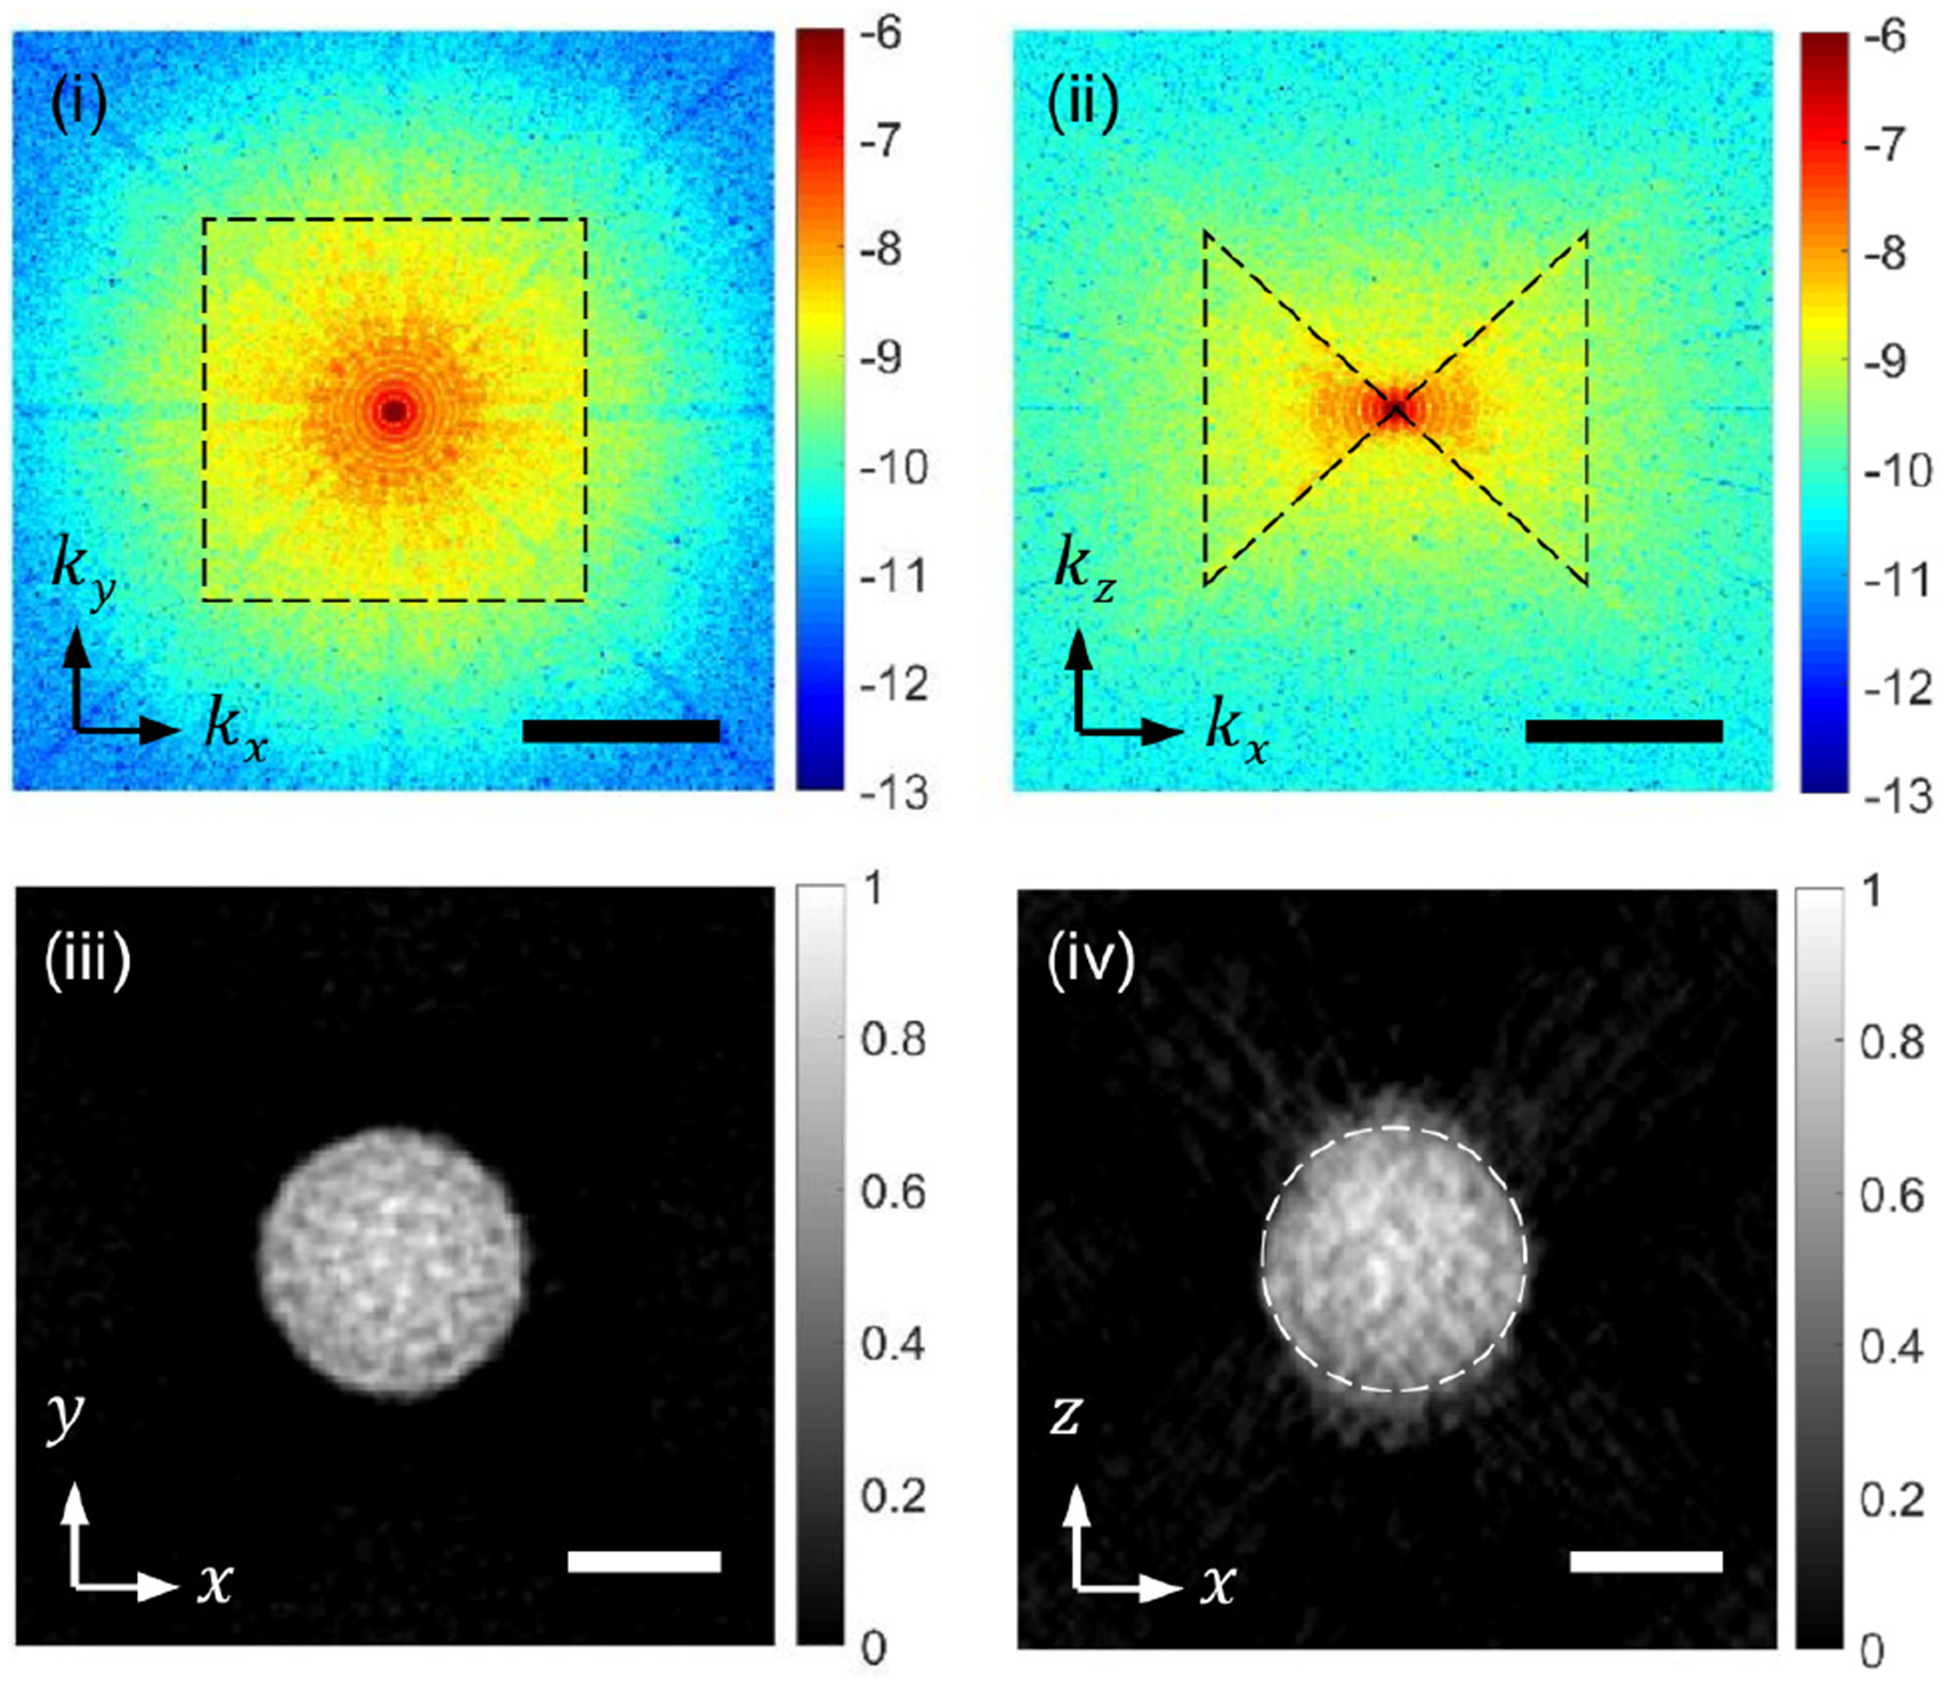
FIG. 6.

Snapshot 3D imaging of a 20-μm fluorescent bead. (i) and (ii) are kx − ky and kx − kz cross-sections, respectively, of 3D spatial-frequency spectrum after the data processing.(iii) and (iv) are the x − y and x − z cross-sections of the 3D fluorescence distribution. Scale bars: 1 μm−1 in (i) and (ii) and 10 μm in (iii) and (iv)
