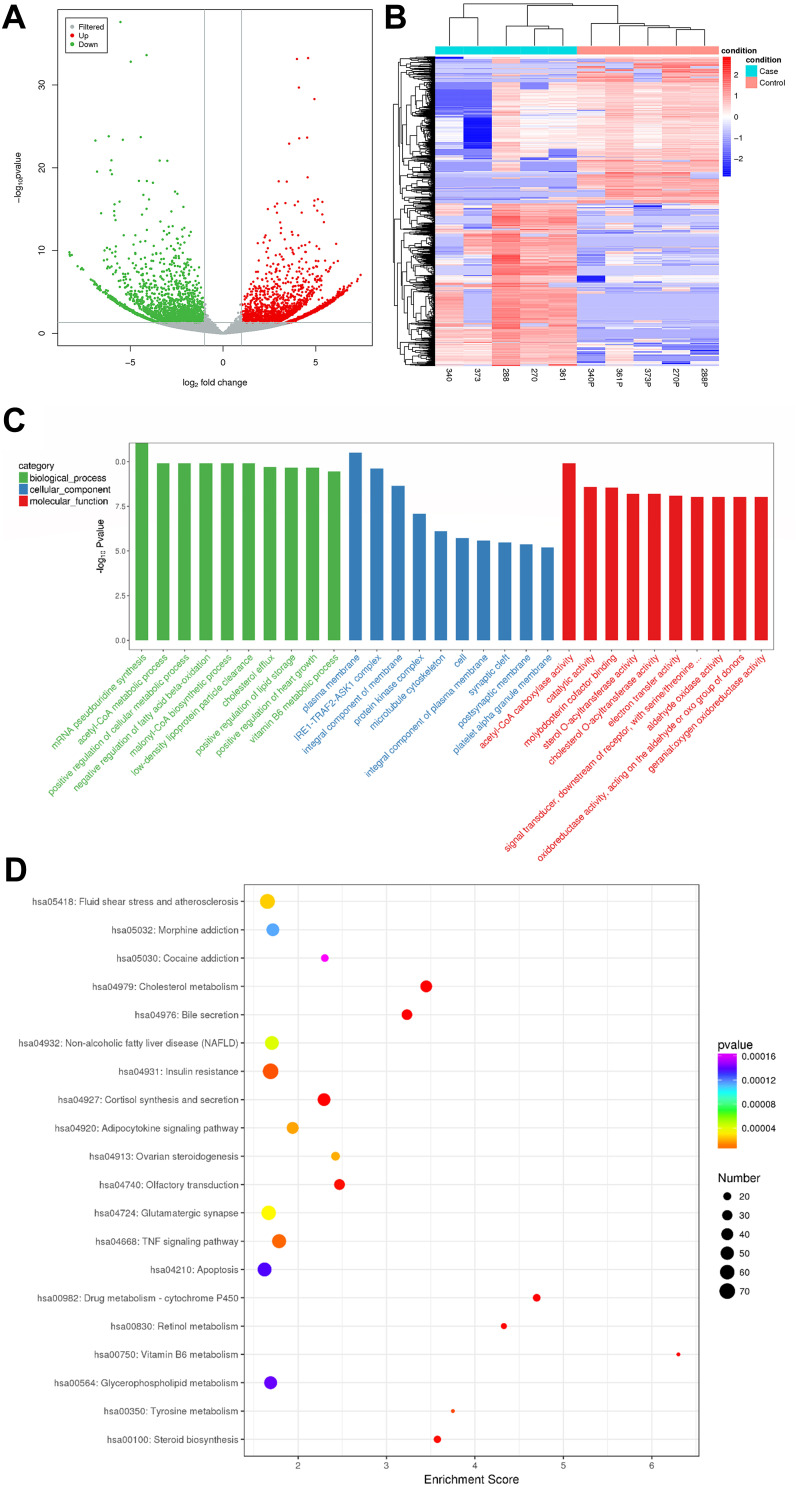
Figure 1.
(A) Volcano plot showing dysregulated circRNAs between neuroblastoma specimens and adjacent normal fetal adrenal medulla. The X-axis represents log2FoldChange, and the Y-axis represents -log10P value. The horizontal gray line indicates a P value of 0.05. The two vertical gray lines indicate a fold increase or decrease of 2 (left, log2FoldChange = −1; right, log2FoldChange = 1). The red and gray points represent significantly up-regulated (n = 2462) and down-regulated (n = 2242) circRNAs in neuroblastoma, respectively. (B) Hierarchical clustering of the dysregulated circRNAs in neuroblastoma specimens and adjacent normal fetal adrenal medulla. Each red or blue bar represents higher or lower expression of circRNA in each specimen. The circRNA expression patterns were distinguishable between the neuroblastoma group and the adjacent normal fetal adrenal medulla group, but similar within the same group. (C) Functional annotation of the host genes of differentially expressed circRNAs, conducted on the basis of gene ontology (GO) analyses. The X-axis represents the GO terms, and the Y-axis represents -log10Pvalue. The green, blue and red bars represent the top ten significantly enriched GO terms in biological processes, cellular components and molecular functions. (D) Bulb map of KEGG pathway analysis for the host genes of differentially expressed circRNAs. The X-axis represents enrichment score, and the Y-axis represents the top 20 enriched pathways. The size of each bulb represents the number of enriched dysregulated circRNAs, and the P values are represented by a color scale.

