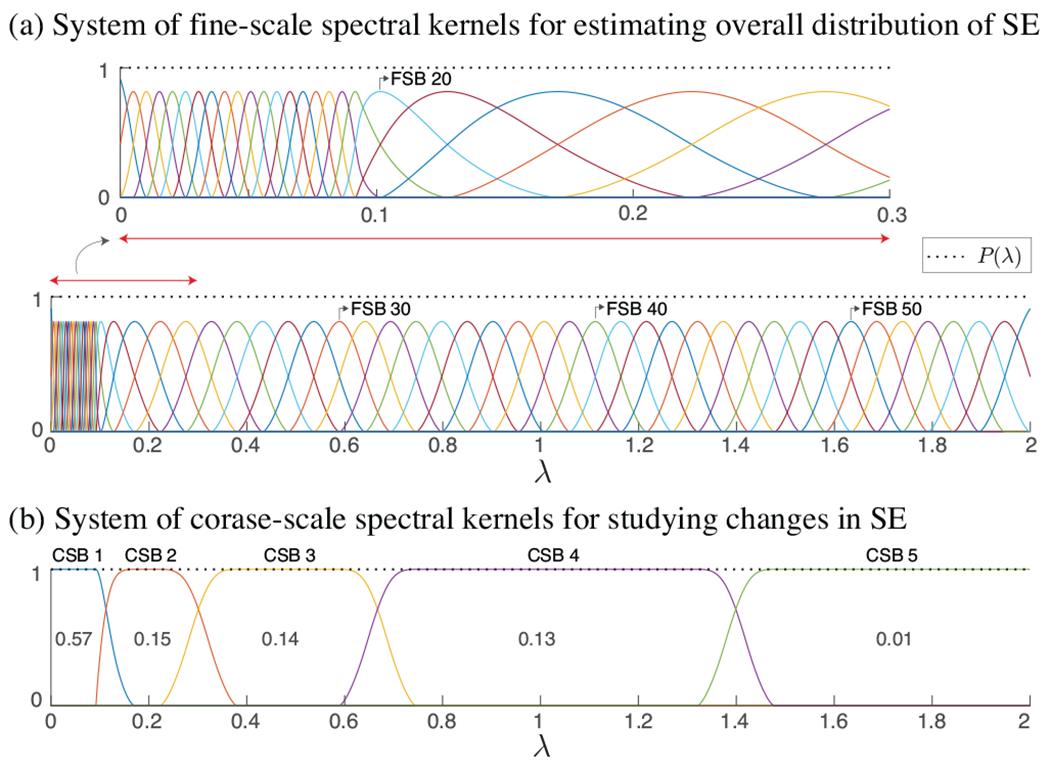
Fig. 1:

System of spectral kernels forming tight Parseval frames. In (a), kernels within the spectral range [0, 0.1] are designed to have narrower bands as the majority of the fMRI signal energy falls in that range. In (b), values shown within the kernels represent the fraction of total SE captured within each sub-band, on average across subjects; see also Fig. 3(a).
