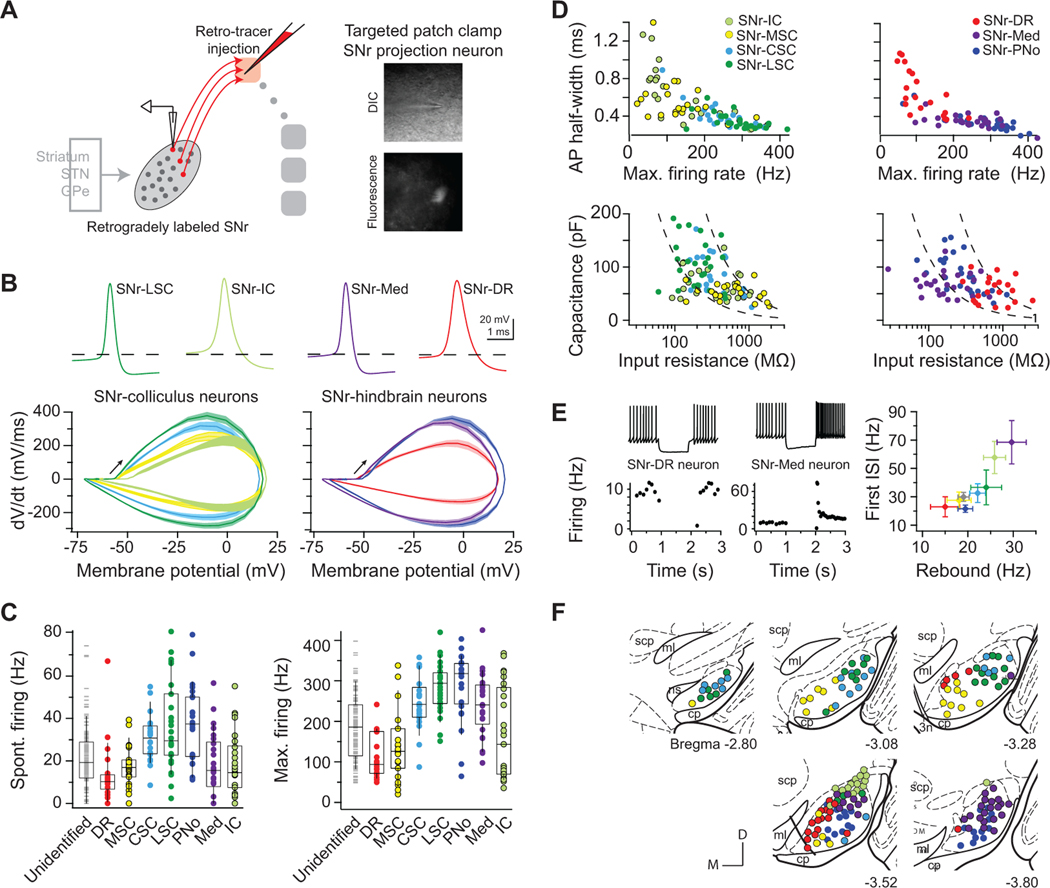
Figure 4. Specialized SNr subpopulations innervate large, functionally distinct brainstem regions.
(A) SNr projection neurons were labeled via retrograde tracer injection into a single downstream brainstem region in each animal, and whole-cell recordings were targeted to fluorescent, retrogradely labeled SNr neurons. 4–7 mice per each target.
(B) Average action potential waveforms and phase-plot kinetics of identified projection neurons. Left: SNr-LSC (green), SNr-CSC (light blue), SNr-MSC (yellow), and SNr-IC (light green) neurons. Right: SNr-PNo (dark blue), SNr-Med (purple), and SNr-DR (red) neurons.
(C) Range of spontaneous and maximum firing rates across projection neuron pools and in randomly targeted SNr neurons (grey). Box plots show quartiles and median (boxes) and 10 – 90% range (whiskers).
(D) Active (top) and passive (bottom) properties of projection neurons fall on a continuum.
(E) SNr neurons projecting to brainstem areas span a range of post-inhibitory rebound firing capabilities. (Left) Example neuron projecting to the dorsal raphe (DR) exhibited no increase in firing in response to hyperpolarization, whereas example neuron projecting to the medullary reticular (Med) exhibited robust rebound firing capabilities. (Right) Average transient and sustained rebound firing rates of each brainstem projection population. Error bars = SEM.
(F) Topographical distributions of SNr projection neuron recording locations, registered to five atlas coronal sections. See also Figures S4-S6.

