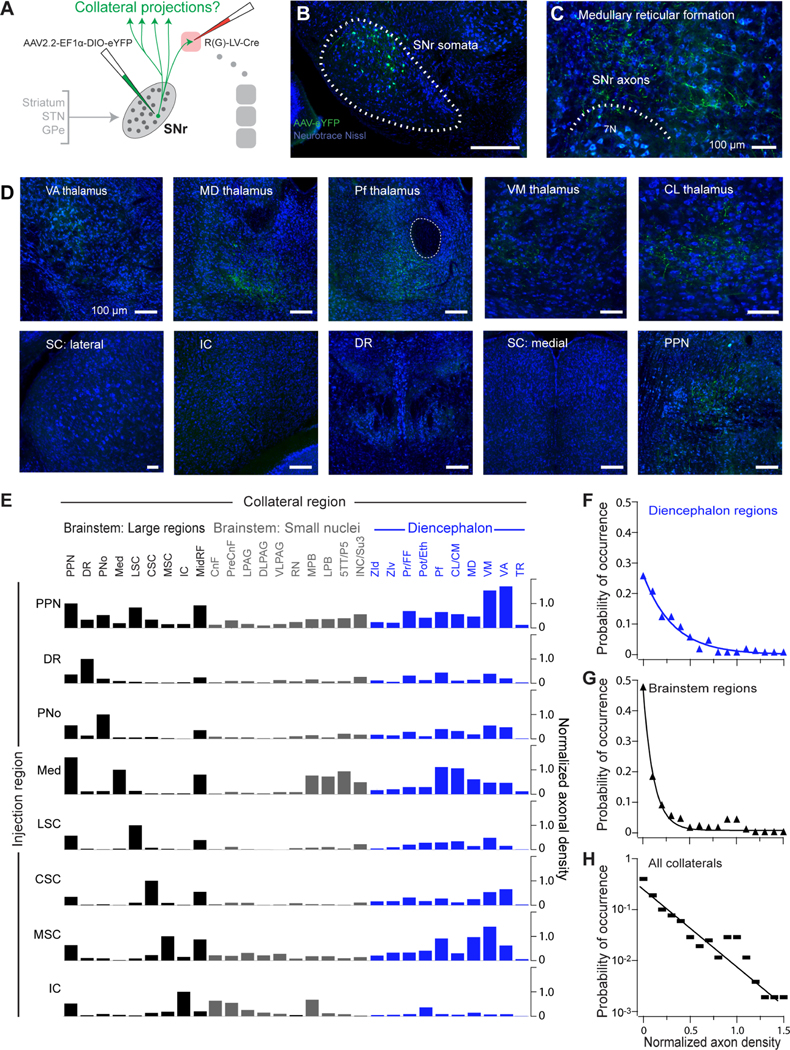
Figure 6. Broad and specific collateralization of SNr outputs demonstrated by projection-based intersectional viral mapping.
(A) Schematic of intersectional viral strategy to map SNr collateral projections across the whole brain. Injections of a retrograde lentivirus expressing Cre (RV(G)-LV-Cre) were made to a single downstream target. A Cre-dependent AAV expressing eYFP was injected into SNr, and the whole brain was serially sectioned and imaged for axon collaterals.
(B) Example injection site showing eYFP+ neurons in SNr following injections of retrograde Cre-expressing lentivirus into the medullary reticular formation and the Cre-dependent AAV expressing eYFP into SNr.
(C) Anterogradely labeled eYFP+ SNr axons at the lentivirus injection site in the medulla.
(D) Anterogradely labeled eYFP+ axon collaterals from SNr-medulla projecting neurons are distributed throughout diverse thalamic nuclei (top) and in the PPN (bottom right), but not in other large brainstem regions.
(E) Collateral projections from different SNr projection populations. Axonal density quantified in each downstream region (left-to-right) following labeling of specific SNr projection populations via injection of retrograde lentivirus expressing Cre to large brainstem regions (left) and AAV complementation in SNr. Axonal density normalized to that in the lentivirus-targeted region. See also Figure S7A.
(F) Compendium of collateral innervation density across diencephalic targets in all experiments.
(G) Compendium of collateral innervation density across brainstem targets.
(H) Occurrence of collateral innervation density across all targets; the line is an exponential with a decay constant of 0.27. See also Figure S7.

