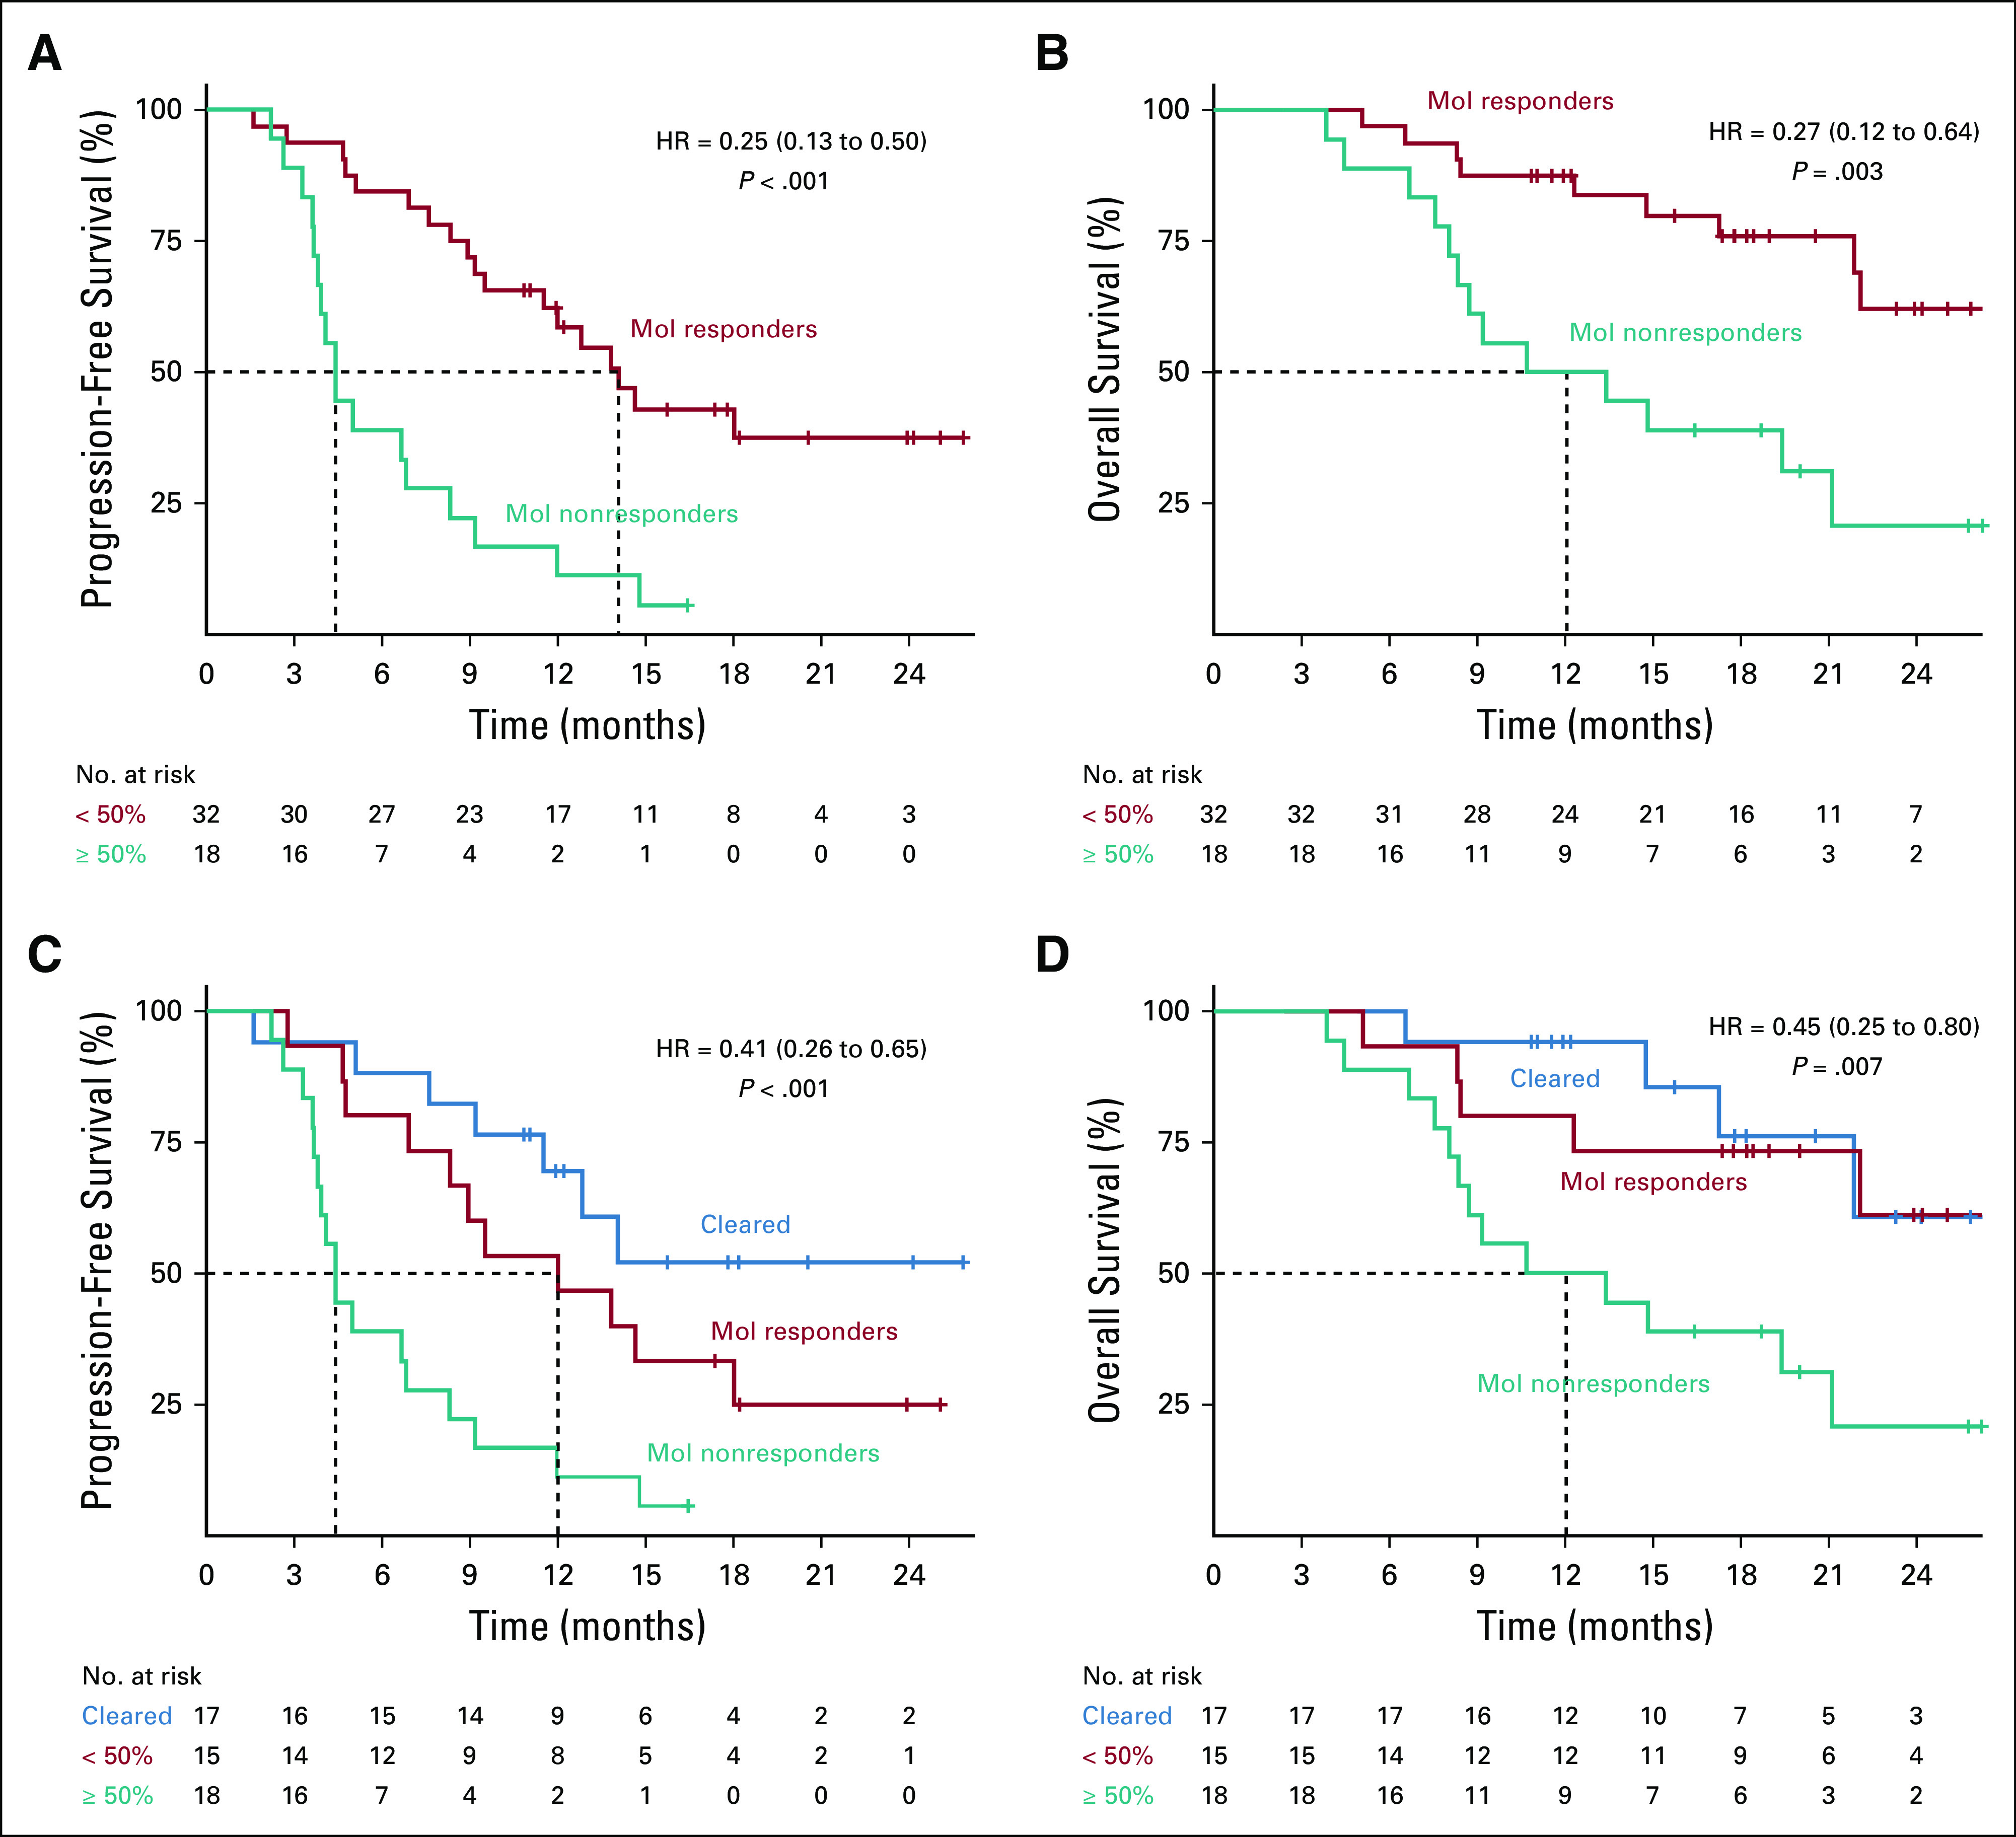
FIG 3.

Association of molecular response with survival outcomes. Kaplan-Meier survival curves using a molecular response cutoff of 50% for (A) PFS and (B) OS. Kaplan-Meier survival curves showing patients with complete clearance of ctDNA at 9 weeks (blue), molecular response > 0% (teal), and molecular response > 50% (red) for (C) PFS and (D) OS. Dotted lines show median survival times for each group; median PFS was not reached for patients with ctDNA clearance (C). Median OS was not reached for patients with ctDNA clearance or molecular response but no clearance (D). ctDNA, circulating tumor DNA; OS, overall survival; PFS, progression-free survival.
