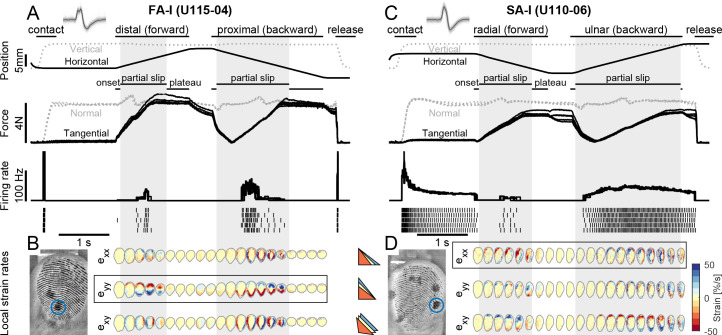
Figure 2. Experimental procedures and typical traces.
(A) Evolution of the global variables, the plate position (vertical in gray and horizontal in black) and the contact force (normal in gray and tangential in black), together with the afferent instantaneous firing rate (and the spikes) as a function of time for a typical fast-adapting type I (FA-I) unit in the high friction condition. The plate was pressed against the fingerpad (‘contact’), moved tangentially forward until the occurrence of a full slip, then moved backward, and finally retracted (‘release’). The partial slip phase is highlighted by the gray vertical boxes. Five repetitions are overlaid. The tangential movement was split into three phases: onset (lasting 100 ms), partial slip, and plateau. (B) Heatmaps of the evolution of the local surface strain rates in the contact area as a function of time during the tangential loading, for one of the five repetitions. The three strain components, axial along x and y, and shearing, are shown (colored triangles depict the deformation axes). Compression (negative strain) is in red. The location of the unit receptive field center is shown with a blue circle on the raw fingerpad image on the bottom left. (C, D) Same as in (A, B) for a typical slowly-adapting type I (SA-I) unit. For both units, insets show recorded, superimposed action potentials and their average shape represented by a dark line.
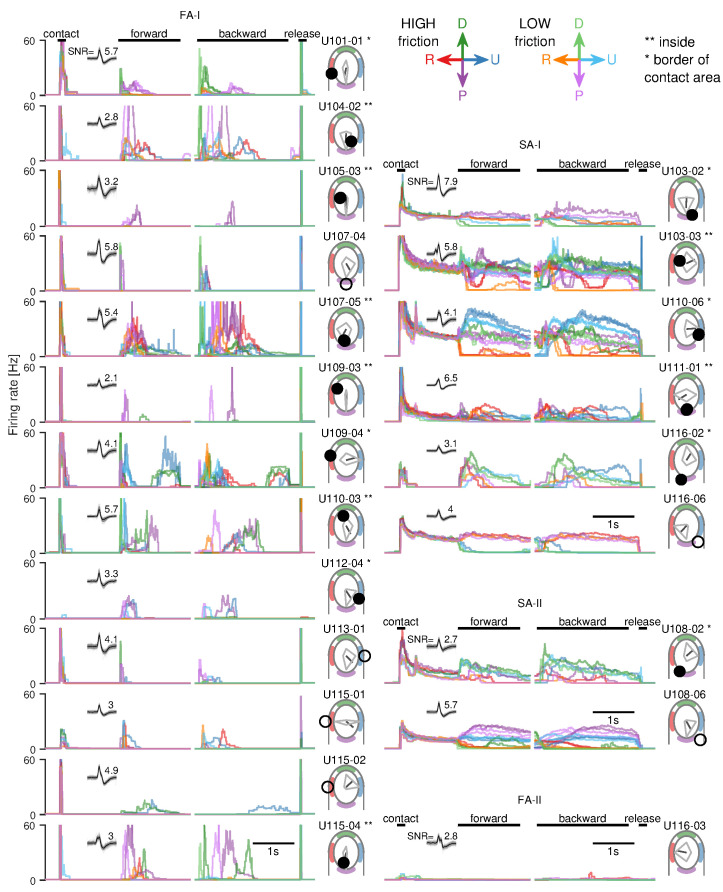
Figure 2—figure supplement 1. Instantaneous firing rate as a function of time for all units recorded and all conditions.
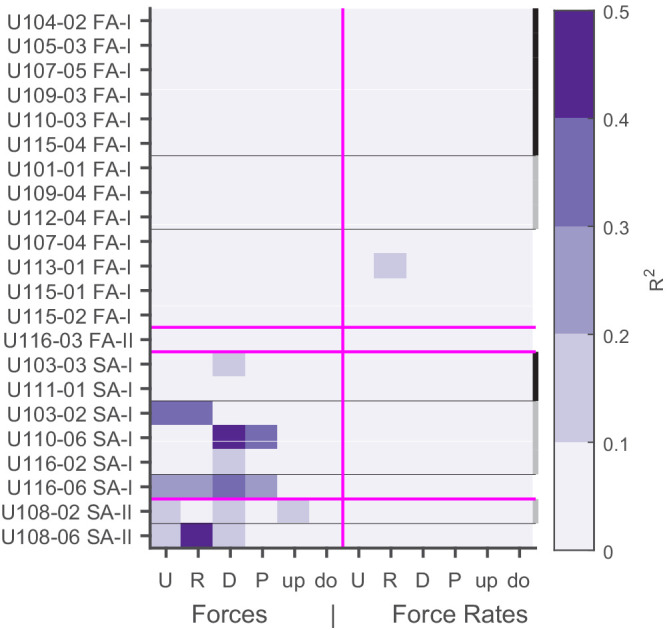
Figure 2—figure supplement 2. Correlation of firing rates with contact forces.


