
Figure 3. Properties of afferents’ responses during tangential loading.
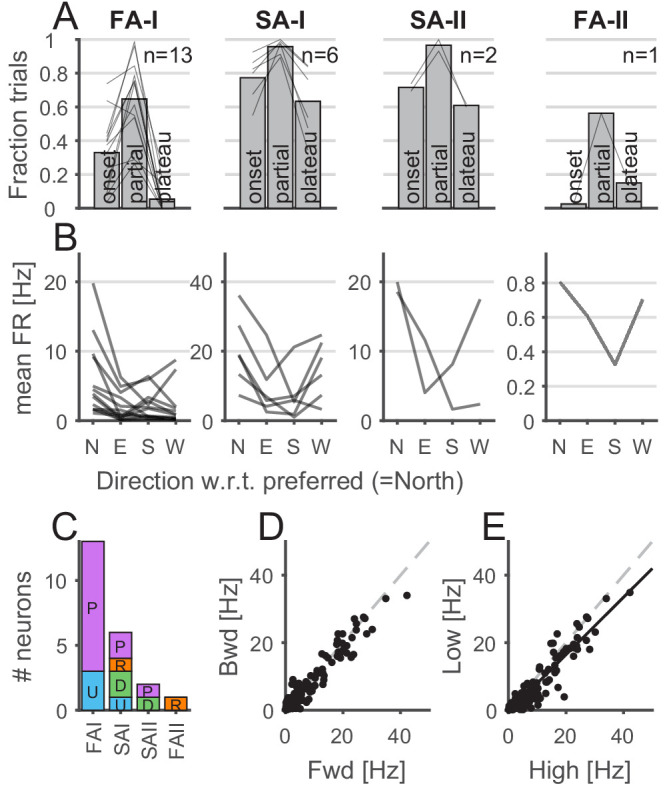
(A) The afferents were mostly active during the partial slip phase. The fraction of trials during which the afferents were active for each phase of the tangential loading (onset, partial, and plateau) for the forward and backward movements. Bars show the average across units, and the lines show individual afferents (n = 13, 6, 2, and 1 for fast-adapting type I [FA-I], slowly-adapting type I [SA-I], slowly-adapting type II [SA-II], and fast-adapting type II [FA-II], respectively). (B) Afferents discharge more in a given direction. Mean firing rates elicited by partial slip as a function of angle with respect to the preferred direction (‘North’) for each unit. Each line shows a different afferent, and the mean firing rate was averaged across repetitions, movements (‘fwd’ or ‘bwd’), and frictions. (C) Distribution of the afferent preferred global direction for each afferent type. (D) Mean firing rate for backward versus forward movements. One data point is shown for each afferent (n = 22) and each condition (8 = 4 direction × 2 friction) and averaged across repetition. The dashed gray line is the slope = 1. (E) Mean firing rate for low versus high friction. One data point is shown for each afferent (n = 22) and each condition (8 = 4 directions × 2 forward-backward) and averaged across repetition. The black line is the least square regression, and the dashed gray line is the slope = 1.