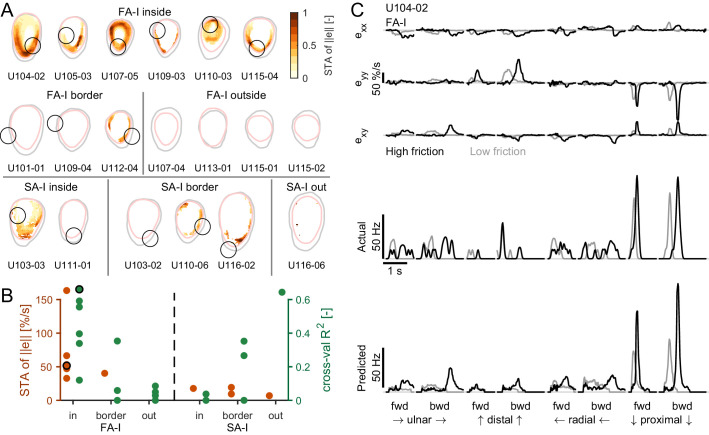
Figure 5. Afferent responses to surface skin strains.
(A) Heatmaps of the spike-triggered average (STA, in orange) for the fast-adapting type I (FA-I) units inside the contact area (top row), the other FA-I units (middle row), and the slowly-adapting type I (SA-I) units (bottom row). The STA matrices were obtained from the norm of the strain () and normalized to the maximal value (reported in B). The gray contour shows the initial contact area, and the pink contour depicts the parts of the contact area that remained in contact for at least 50% of the partial slip phase. The black circle is the unit receptive field. (B) STA peak value (red) and linear regression model performance (green). For units in or on the border of the contact area, the maximum was taken inside the receptive field. For units outside the contact area, the maximum was taken anywhere inside the contact area. The STA of some units were undefined over the whole contact area (see Materials and methods); those units are not shown. The unit shown in (C) is highlighted with a black circle. (C) Time evolution of the strain rates inside the receptive field, the actual firing rate (represented as spike events convolved with a Gaussian kernel, see Materials and methods), and the predicted firing rate of an example unit during partial slip for each direction and each friction (black is high friction, gray is low friction).
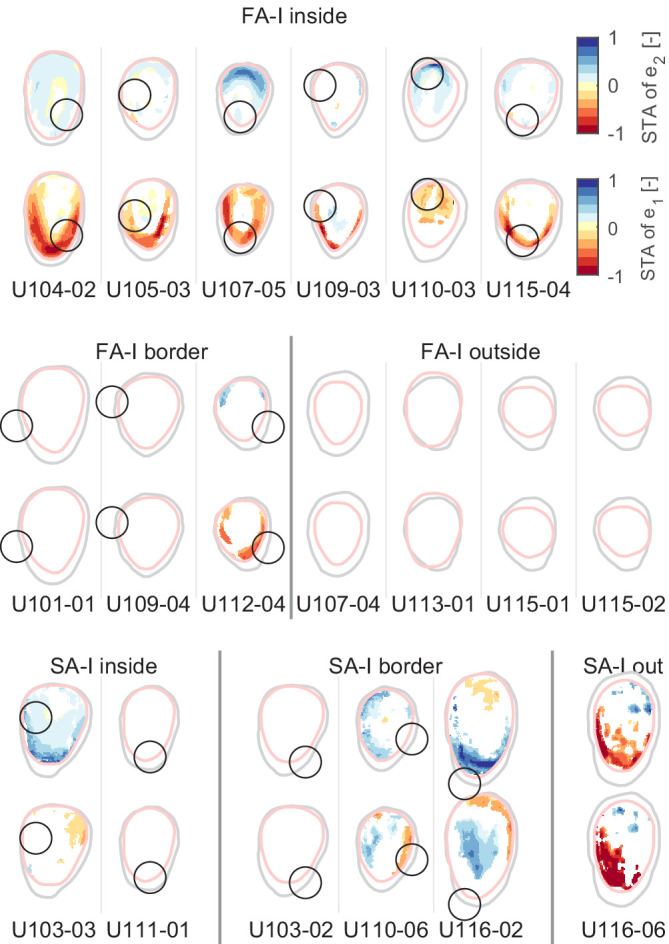
Figure 5—figure supplement 1. The same heatmaps as in Figure 5A but showing the spike-triggered average (STA) for the two principal strain rates (e1, compressive, and e2, tensile).

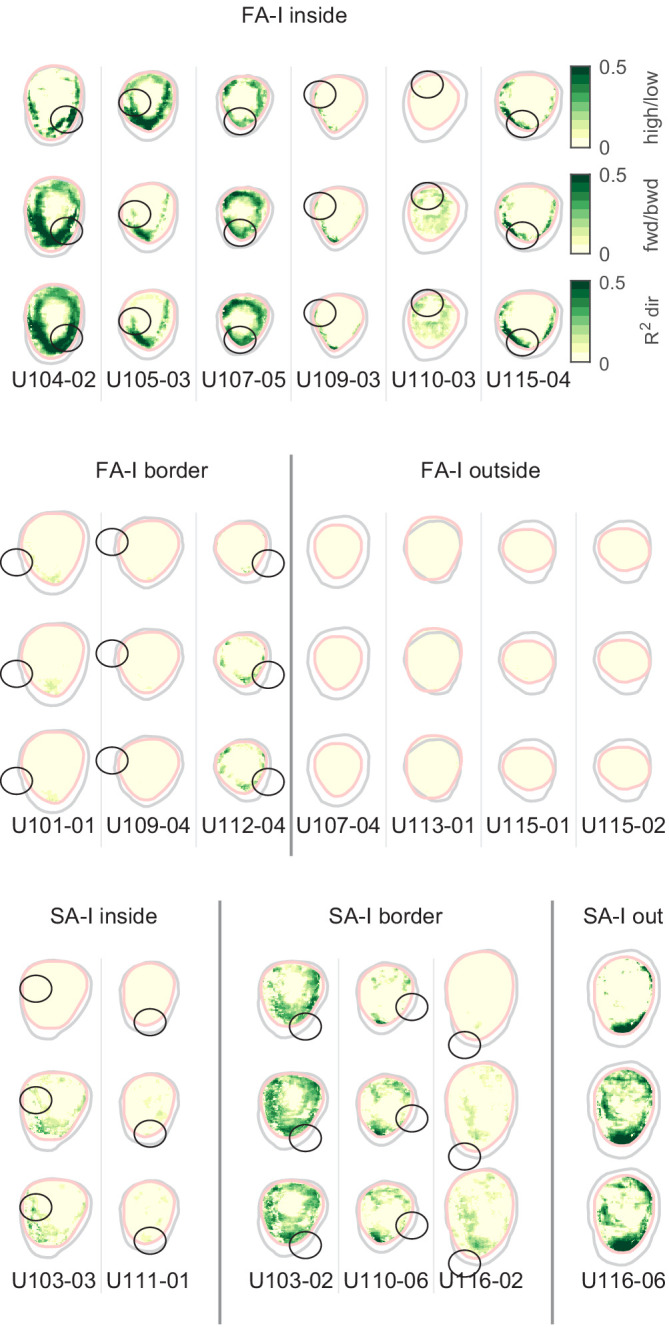
Figure 5—figure supplement 2. The same heatmaps as in Figure 5A but showing R2 for friction, direction, and forward/backward cross-validation methods.


