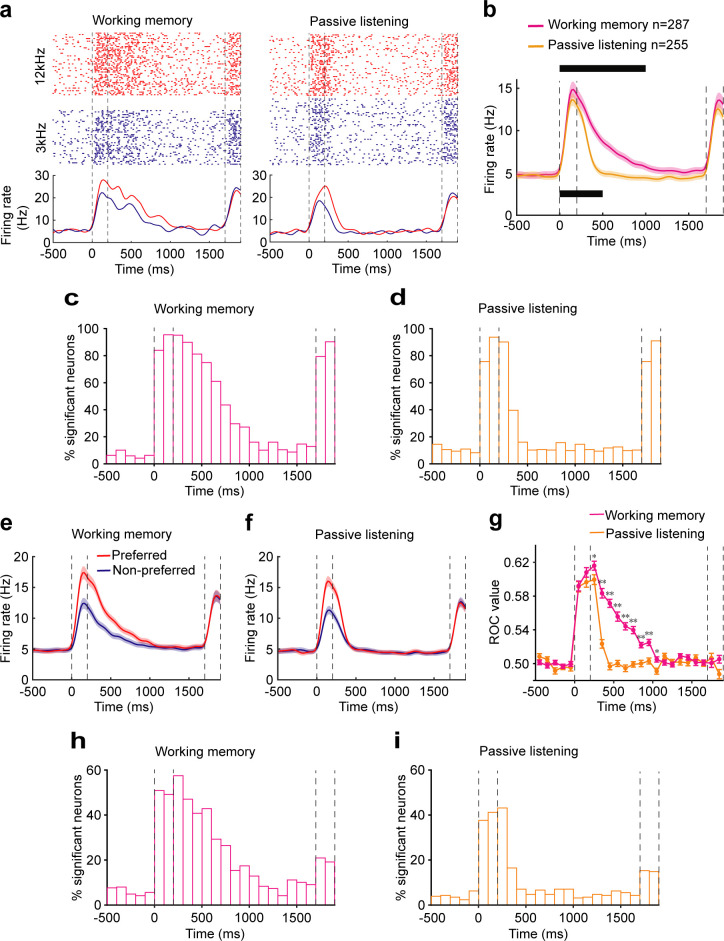
Figure 2. Neural correlates of the auditory cortex activity in the auditory working memory (WM) task.
(a) Raster (top) and peri-stimulus time histograms (bottom) of an example neuron recorded during the WM behavior (left) and passive listening (right). Trials were sorted by auditory samples. The sample stimulus and test stimulus times are bounded by the vertical dotted lines. (b) Averaged population firing rates for neurons recorded during WM behavior (n = 287) and passive listening (n = 255). Shadows: s.e.m.; the black block on the top indicates the successive 100 ms bins with firing rate significantly different from baseline (500 ms before the beginning of sample) for neurons recorded during WM behavior. p<0.05, Wilcoxon rank-sum test. The black block below indicates significant bins for neurons recorded during passive listening. (c, d) Percentage of neurons with a significant difference in firing rate compared with baseline at different time points during WM behavior (c) and passive listening (d). (e, f) Averaged population firing rates for neurons recorded during WM behavior (e) and passive listening (f). Trials in which the sample stimulus was the preferred or nonpreferred, which varied for each neuron, are shown separately. (g) The average of receiver operating characteristic (ROC) values across populations, calculated in each 100 ms window, is plotted as a function of time for neurons recorded during WM behavior (magenta) and passive listening (orange). *p<0.05, **p<0.001, Wilcoxon rank-sum test. (h, i) Incidence of neurons with significant ROC values for each 100 ms epoch in WM behavior (h) and passive listening (i). p<0.05, permutation test.


