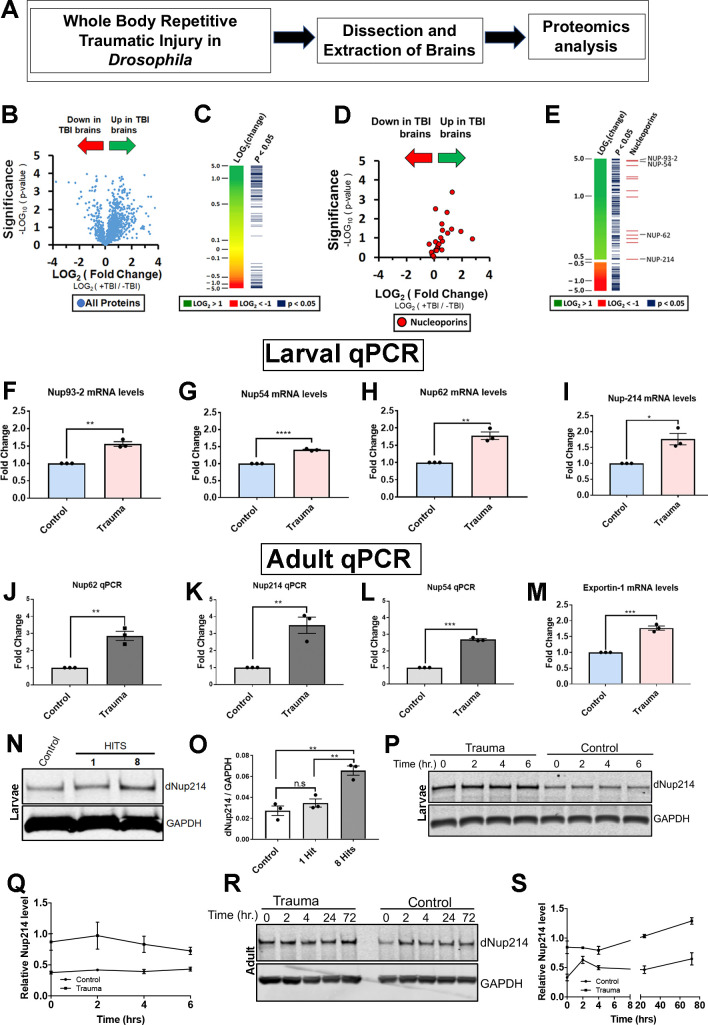
Figure 1. Proteomic analysis of Drosophila brains identifies novel components of the nucleocytoplasmic transport machinery that are disrupted in response to TBI.
(A) Schematic flow of Drosophila larval brain traumatic injury, dissection, and proteomics analysis. (B) Volcano plot showing fold-change and p-values for all detected proteins (student’s t-test, assuming equal variances). (C) Heat map showing change in protein expression for 2000 detected proteins. Proteins with a significant change (p < 0.05) are indicated. (D) Volcano plot showing fold change and p-values of all nucleoporins and nuclear transport proteins. Traumatic injury upregulates components of the nuclear pore and nucleocytoplasmic transport. (E) Heat map and p-values for proteins with more than ±1.4-fold change with the indicated nucleoporins. (F–I) Quantitative reverse-transcriptase polymerase chain reaction (qRT-PCR) analysis of nucleoporins identified in the proteomics analysis showed significant increases in (F) Nup93-2, (G) Nup54, (H) Nup62, and (I) Nup214 mRNA levels in w1118 Drosophila larval brains exposed to trauma (eight hits @ 50° angle) compared to control animals (n = 3, *p < 0.05, **p < 0.01, ****p < 0.0001). (J–L) qPCR analysis of Nup62 (J, **p < 0.01), Nup214 (K, **p < 0.01), and Nup54 (L, **p < 0.001) mRNA levels in adult Drosophila brains showed a significant increase in response to trauma as compared to control brains (n = 3). (M) qRT-PCR analysis of nuclear export factor Emb (exportin) mRNA post-trauma compared to non-trauma controls (n = 3, ***p < 0.001). (N) Western blot of Drosophila larval brains exposed to trauma (one or eight hits @ 50° angle) and controls (0 hits) probed for Nup214 protein. Drosophila Gapdh is shown as a loading control. (O) Quantification of western blots of Drosophila Nup214 protein levels compared to controls (n = 3, **p < 0.01, ***p < 0.001, n.s. = not significant). (P) Western blot of Nup214 protein level in larval brains at 0, 2, 4, and 6 hr post-injury or controls. (Q) Quantification of Nup214 protein levels in larval brains of trauma and control at 0, 2, 4, and 6 hr (n = 3). (R) Western blot of Nup214 protein level in adult brains at 0, 2, 4, 24, and 72 hr post-injury or controls. (S) Quantification of Nup214 level levels in adult brains of trauma and control at 0, 2, 4, 24, and 72 hr (n = 3). All qRT-PCR and western blot analysis were done in triplicate using biological replicates. One-tailed t-test was used in panels F–L and O. One-way ANOVA with Tukey’s multiple comparisons tested was used for panel N. All quantification represents mean ± s.e.m.


