. 2021 Jun 1;10:e67587. doi: 10.7554/eLife.67587

Figure 4. Nup62 expression promotes TDP-43 mislocalization and aggregation in vivo and in vitro.

(A) Drosophila larval brain overexpressing Nup62 (Nup62 OE) in motor neurons (Ok371-gal4) and controls (eGFP) stained for the Drosophila homolog of TDP-43, TAR DNA-binding protein-43 homolog (Tbph), and the nuclear envelope marker Lamin, showing Tbph accumulation. Scale bar = 25 µM. Zoom image represents inset box. (B) Quantification of the number of Tbph puncta in Nup62 OE flies compared to controls (n = 5–7, ***p< 0.001). (C) Nuclear Tbph intensity in Nup62 OE flies compared to controls (n = 5–7 brains, **p < 0.01). (D) Western blots of cytoplasmic (C) and nuclear (N) fractions from Drosophila expressing Nup62 OE in motor neurons and control probed for Tbph, lamin, and tubulin. (E) Nuclear-cytoplasmic (N/C) ratio quantification of Tbph in Nup62 OE and control animals (n = 3 blots, **p < 0.01). (F) Western blots of soluble (S) and insoluble (I/S) fractions Drosophila expressing Nup62 OE in motor neurons and controls probed for Tbph and tubulin. (G) Percentage of Tbph solubility in Nup62 OE and control motor neurons (n = 3 blots, **p < 0.01). (H) qRT-PCR analysis of Nup62 mRNA in Nup62 OE animals compared to controls (n = 3, ***p < 0.001). (I) Representative immunofluorescence images of human embryonic kidney 293T (HEK293T) cells transfected with mRuby alone (red) and NUP62-mRuby show endogenous TDP-43 (green) coaggregation with NUP62. NUP62-mRuby co-localizes with endogenous TDP-43 (merge, yellow). Scale bar = 25 µM. (J) Western blots of soluble and insoluble fractions from HEK293T cells transfected with mRuby alone or NUP62-mRuby probed for TDP-43 and tubulin. (K) Quantification of TDP-43 solubility in HEK293T cells transfected with mRuby alone or NUP62-mRuby (n = 3 blots, **p < 0.01). (L) Representative immunofluorescence images of HEK293T cells transfected with NUP62 show phosphorylated TDP-43 accumulation (green) that co-localizes with NUP62 (merged, yellow). Scale bar = 25 µM. qRT-PCR and western blot analysis were done in triplicate using biological replicates. One-tailed t-test was used in panel B, C, E, G, H, and K. All quantification represent mean ± s.e.m.

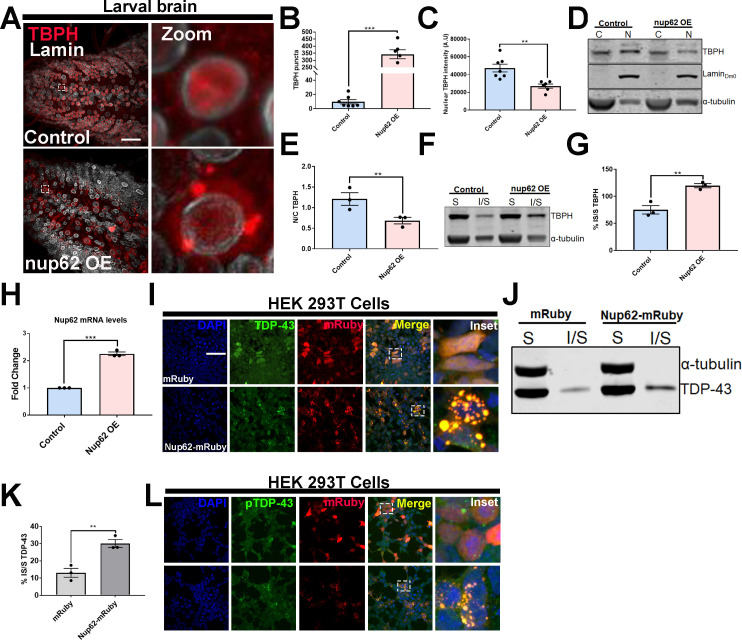
Figure 4.

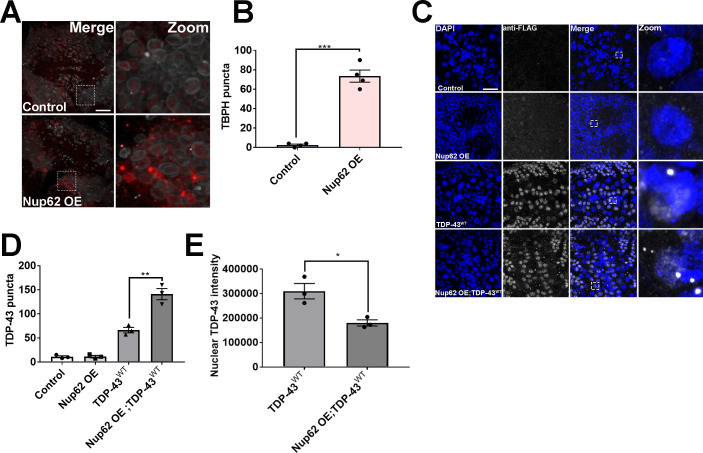
Figure 4—figure supplement 1. Nup62 expression modulates TBPH and TDP-43 aggregation as well as mislocalization.

Figure 4—figure supplement 1.

(A) Representative immunofluorescence images of adult Drosophila brain overexpressing Nup62 (Nup62 OE) in motor neurons show Tbph (red) aggregation compared to eGFP controls. Lamin was used as a nuclear envelope marker. Inset box corresponds to zoom image. Scale bar = 20 µM. (B) Quantification of Tbph puncta in Nup62 OE and eGFP control brains (n = 4, ***p < 0.001). (C) Representative immunofluorescence images of CRISPR/Cas9 FLAG-tagged human wild-type TDP-43 (TDP-43WT) Drosophila larval brains overexpressing Nup62 (Nup62 OE) in motor neurons stained with anti-FLAG and DAPI. Scale bar = 20 µM. (D) Quantification of TDP-43 puncta (anti-FLAG) in control, Nup62 OE, TDP-43WT, and Nup62 OE; TDP-43WT brains (n = 3, **p < 0.01). (E) Quantification of nuclear TDP-43 (anti-FLAG) intensity in TDP-43WT and Nup62 OE; TDP-43WT brains (n = 3, *p < 0.05). One-way ANOVA with Tukey’s multiple comparisons test was used for panel D, and t-test was used for panel B and E. All quantifications represent mean ± s.e.m.
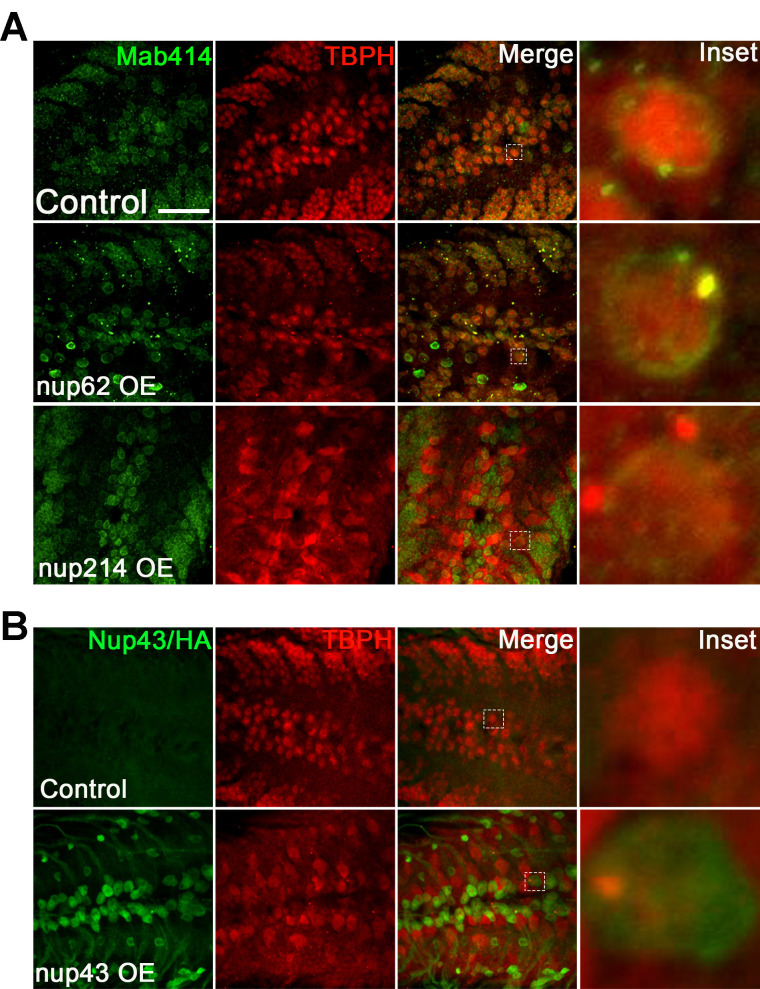
Figure 4—figure supplement 2. Expression of Nup62 but not Nup214 or Nup43 leads to NPC/TBPH coaggregation.

Figure 4—figure supplement 2.

(A) Larval VNCs overexpressing Nup62, Nup214, or eGFP control in motor neurons stained with Tbph (red) and NPC/Mab414 (green). Tbph colocalized with NPC/Mab414 (merge) in Nup62 OE but not Nup214 animals. (B) Larval VNCs expressing HA-tagged Nup43 (Nup43 OE) or eGFP control in motor neurons stained with Tbph (red) and Anti-HA (green). Scale bar = 20 µM.
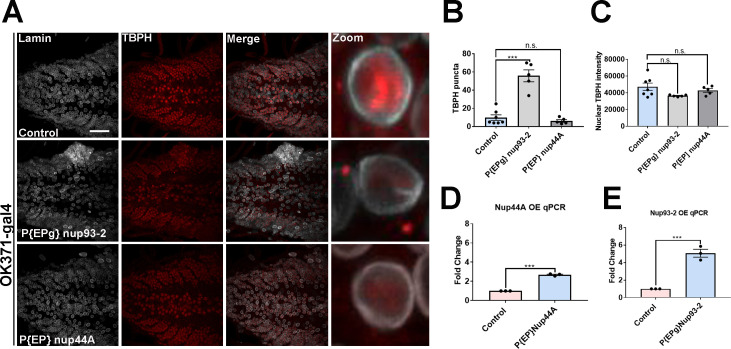
Figure 4—figure supplement 3. Increased Nup93-2 but not Nup44A expression partially leads to TBPH mislocalization and aggregation in vivo.

Figure 4—figure supplement 3.

(A) Larval brains expressing Nup93-2 or Nup44A and w1118 control stained for Tbph and the nuclear envelope marker Lamin show Tbph accumulation. Scale bar = 25 µM. Inset box corresponds with zoom image. (B) Quantification of number of Tbph puncta in Nup93-2 or Nup44A overexpressing animals compared to controls (n = 5–7, ***p < 0.001, n.s. = not significant). (C) Quantification of nuclear Tbph intensity in Nup93-2 or Nup44A expressing animals compared to controls (n = 5–7, n.s. = not significant). (D) qPCR analysis of Nup44A mRNA levels in expressing animals compared to controls (***p < 0.001). (E) qPCR analysis of Nup93-2 mRNA levels in expressing animals compared to controls (***p < 0.001). One-way ANOVA with Tukey’s multiple comparisons tested was used for panels B and C; t-test was used for panels D and E. All quantifications represent mean ± s.e.m.
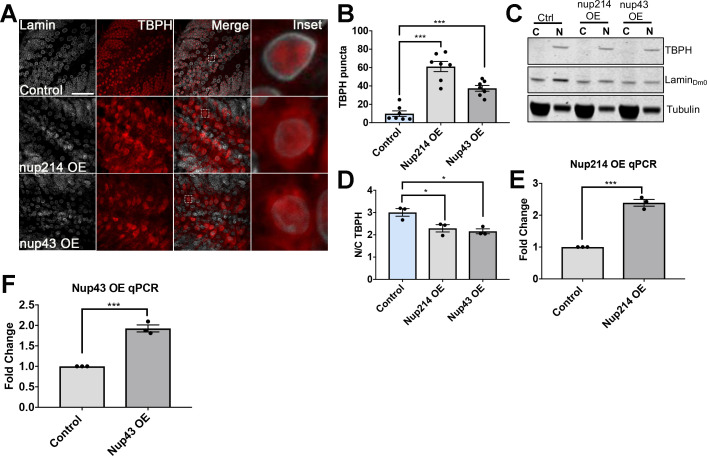
Figure 4—figure supplement 4. Nup214 and Nup43 expression leads TDP-43 mislocalization and aggregation.

Figure 4—figure supplement 4.

(A) Drosophila larval brain overexpressing Nup214 (Nup214 OE), HA-tagged Nup43 (Nup43 OE), or eGFP controls (controls) in motor neurons (OK371-gal4) stained for the Tbph (red), and the nuclear envelope marker Lamin, show Tbph accumulation. Scale bar = 20 µM. (B) Quantification of the number of Tbph puncta in Nup214 OE or Nup43 OE flies compared to controls (n = 7, ***p< 0.001). (C) Western blots of cytoplasmic (C) and nuclear (N) fractions from Nup214 OE, Nup43 OE, and control motor neurons probed for Tbph, Lamin, and tubulin. (D) Nuclear-cytoplasmic (N/C) ratio quantification of Tbph in Nup214 OE, Nup43 OE and control animals (n = 3 blots, **p < 0.05). (E) qRT-PCR analysis of Nup214 mRNA in Nup214 OE animals compared to controls (n = 3, ***p < 0.001). (F) qRT-PCR analysis of Nup43 mRNA in Nup43 OE animals compared to controls (n = 3, ***p < 0.001). One-way ANOVA with Tukey’s multiple comparisons tested was used for panels B and D; t-test was used for panels E and F. All quantifications represent mean ± s.e.m.
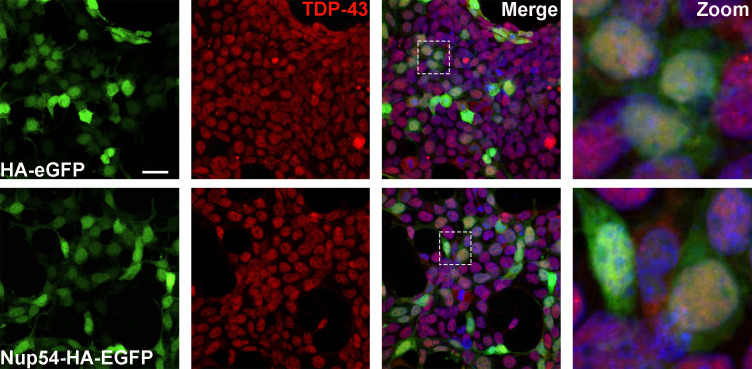
Figure 4—figure supplement 5. NUP54 expression does not alter TDP-43 localization.

Figure 4—figure supplement 5.

Representative immunofluorescence images of HEK293T cells expressing HA-eGFP or NUP54-HA-EGFP and stained for endogenous TDP-43 (red). Inset box corresponds to zoom image. Scale bar = 25 µM.
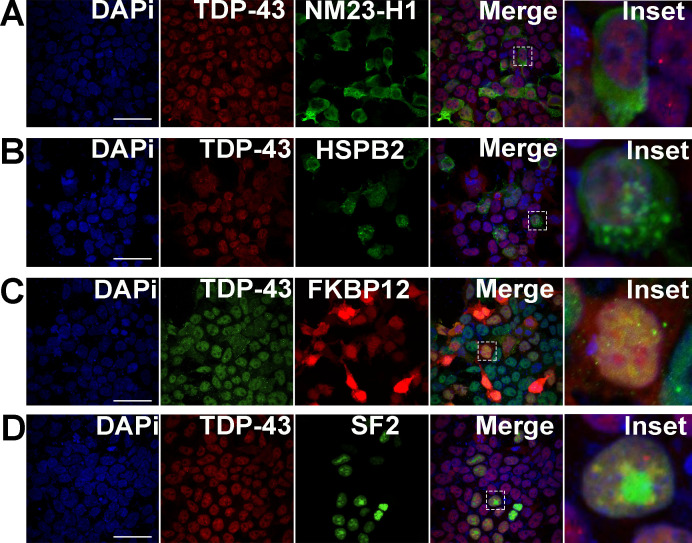
Figure 4—figure supplement 6. Expression of other upregulated proteins in the top five categories does not alter TDP-43 localization.

Figure 4—figure supplement 6.

Representative immunofluorescence images of HEK293T cells expressing: (A) nucleoside diphosphate kinase 1 (NME1, green), the human homolog of Drosophila awd; (B) heat-shock protein family B (small) member 2 (HSPB2), the human homolog of Drosophila heat-shock protein 27 (HSP27); (C) peptidyl-prolyl cis-trans isomerase (FKBP1A), the human homolog of Drosophila Fkbp12; or (D) SRSF1, the human homolog of Drosophila SF2. TDP-43 (red) localization was not altered in any of these conditions. Scale bar = 15 µM.