. 2021 May 4;10:e66165. doi: 10.7554/eLife.66165

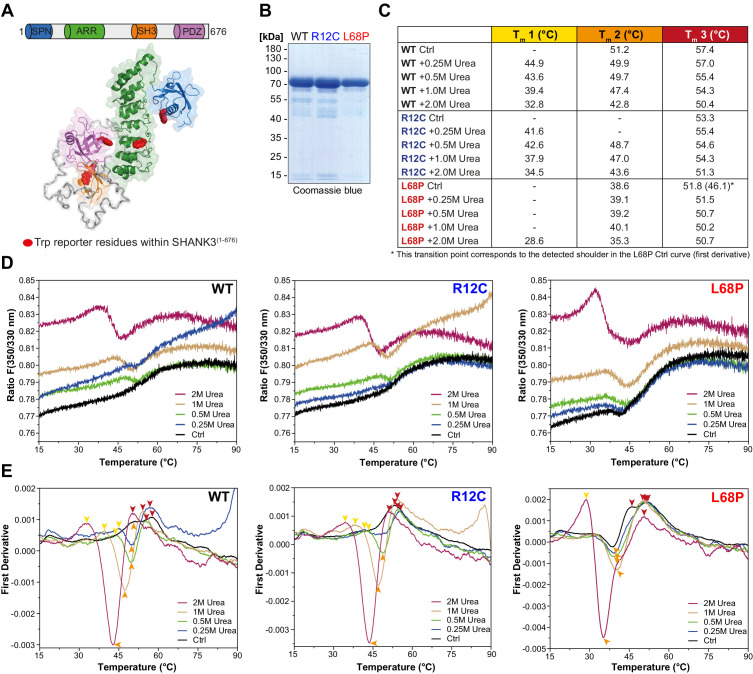
Figure 2. ASD-associated SHANK3 mutations differentially affect protein tertiary structure.

(A) Schematic representation of the SHANK3(1-676) fragment, which was used for nDSF measurements. Intrinsic tryptophan (Trp) reporter residues are highlighted in the structure, which was derived from SAXS data. (B) SDS-PAGE of Ni2+-NTA purified SHANK3(1-676) variants which were used for nDSF and CD spectroscopy. (C) Overview of detected melting points from peaks of first derivative curves (from E). Due to the complex melting behavior, melting was classified in three transition zones (Tm1Tm3) which are partially overlapping. (D) Label-free determination of thermal and chemical stability of purified SHANK3(1-676) variants by intrinsic fluorescence emission depicted as ratio of 350/330 nm as a function of temperature. Melting curves were acquired at a protein concentration of ~0.5 mg/mL, 50% excitation power and with a heating rate of 1°C/min. (E) First derivative analysis of melting curves shown in (D). Transition points are indicated with colored arrowheads (color-coded according to the transition zones) and shifted toward lower temperatures with increasing urea concentration, as expected. For the L68P mutant, considerably lower melting points are detected compared to the WT or R12C mutant, suggesting a reduced thermal stability of the tertiary structure. ASD = autism spectrum disorders, SAXS = small-angle X-ray scattering, WT = wild type.

Figure 2—source data 1. ASD-associated SHANK3 mutations differentially affect protein tertiary structure.
elife-66165-fig2-data1.xlsx (811.4KB, xlsx)

Figure 2.

Figure 2—figure supplement 1. Intrinsic tryptophan fluorescence emission spectra of His6-SUMO-SHANK3(1-676) variants.
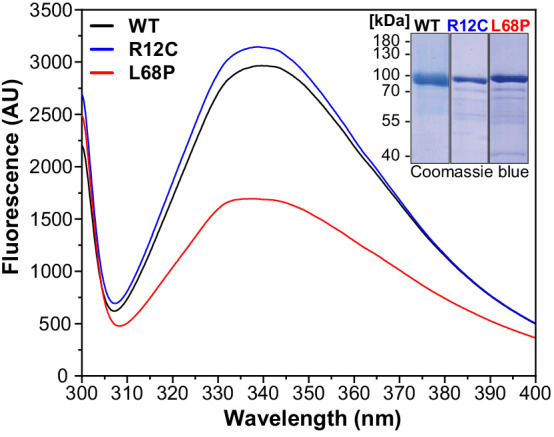
Figure 2—figure supplement 1.

Fluorescence spectra were recorded from 2 µM protein solutions at room temperature (excitation wavelength = 295 nm, scan speed = 240 nm/min). Spectra show a profound reduction in tryptophan fluorescence intensity of the ASD-associated L68P mutant, suggesting an increased fraction of exposed tryptophan residues due to solvent quenching, which could be attributed to partial unfolding of the L68P mutant. This effect is absent for the R12C mutant. The inset shows representative SDS gels from Ni2+-IDA purified His6-SUMO-SHANK3(1-676) variants. ASD = autism spectrum disorders, IDA = imidazole, WT = wild type.
Figure 2—figure supplement 2. Measurement of His6-SUMO-SHANK3(1-676) surface hydrophobicity by extrinsic ANS fluorescence spectroscopy.

Figure 2—figure supplement 2.

(A) Fluorescence spectra were acquired from a 2 µM protein solution in purification buffer at room temperature after addition of 10–100 µM 1-anilinonaphthalene-8-sulphonate (ANS) in a 10 mm rectangular quartz cell (excitation wavelength = 365 nm, scan speed = 240 nm/min). Fluorescence intensity at the ANS emission maximum of 480 nm increased continuously by increasing concentration of ANS up to 100 µM within the same sample. (B) In the presence of 10 µM ANS, the fluorescence intensity at 480 nm is reduced compared to the WT. Overall, however, extrinsic ANS fluorescence spectra do not show significant differences between the R12C mutant and WT. (C) Fluorescence intensities are generally increased significantly for the L68P mutant, suggesting an increased protein surface hydrophobicity. This is consistent with intrinsic tryptophan fluorescence emission and SAXS data indicating that the L68P mutant is partially unfolded under these conditions. SAXS = small-angle X-ray scattering, WT = wild type.