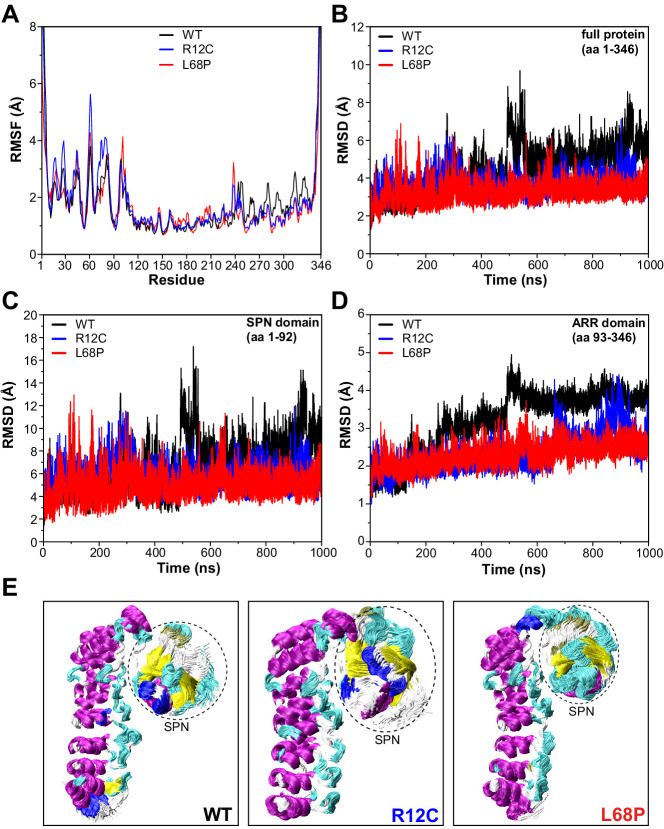
Figure 4. SHANK3 mutants show altered intra-domain conformational dynamics.
(A) Cα backbone RMSF calculated for the trajectories of the SHANK3(1-346) fragment (PDB: 5G4X) either as WT or carrying one of the ASD-associated mutations R12C (blue) or L68P (red) show increased fluctuations for both mutants predominantly within the first 100 residues of the protein possibly suggesting a local mutation-induced increase in protein backbone dynamics. (B) Cα backbone RMSD determined for the full protein (aa 1–346). Within the first 100ns both mutants tend to show slightly increased backbone dynamics. This effect inverts with extended sampling time and mutants show on average reduced conformational dynamics compared to the WT. (C) Cα backbone RMSD restricted to the SPN domain of SHANK3 (aa 1–92). The traces resemble those observed for the full protein (aa 1–346) but absolute RMSD values are considerably larger for the SPN domain. (D) Cα backbone RMSD restricted to the ARR domain of SHANK3 (aa 93–346). The WT protein shows a stepwise increase in RMSD over time possibly indicating switches between distinct conformational states. This behavior is largely missing in both mutants but is more prominent for the L68P variant. (E) Local hotspots of conformational dynamics can be seen within the SPN domain (encircled) from overlays of individual frames of the trajectory (every fifth frame loaded, overlay [beginning:step:end]=0:20:20002 resulting in 1000 frames). RMSF = root mean square fluctuation, WT = wild type, ASD = autism spectrum disorders, RMSD = root mean square deviation.

