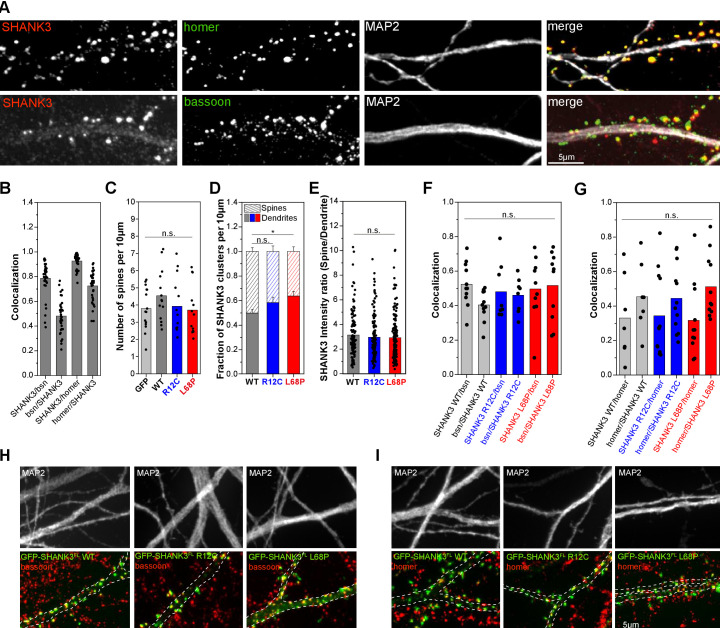
Figure 5. Mutant SHANK3 variants form more clusters in dendritic shaft.
(A) Representative images of immunostained endogenous SHANK3 (red), homer or bassoon (green), and MAP2 (gray). (B) Quantification of the co-localization (SHANK3/bsn and bsn/SHANK3: n = 36 cells from two independent cultures; SHANK3/homer and homer/SHANK3: n = 36 cells from two independent cultures). Bars are showing the mean as well as individual data points. Approximately 72% of homer-positive spines are also SHANK3-positive, while ~93% of SHANK3-positive spines co-localize with homer. Additionally, ~79% of SHANK3-positive spines co-localize with the presynaptic marker bassoon. (C) Quantification of the total number of spines per 10 µm in primary rat hippocampal neurons overexpressing GFP-SHANK3FL variants for 16–18 hr (GFP: 15 cells from four independent cultures, WT: 14 cells from three independent cultures, R12C: 13 cells from four independent cultures, L68P: 13 cells from four independent cultures). Bars are showing the mean as well as individual data points. No significant differences in average spine numbers is found (Kruskal-Wallis ANOVA with Dunn’s post hoc test: p=0.59–1). (D) Analysis of SHANK3 cluster distribution in neurons overexpressing GFP-SHANK3FL variants (same dataset as in (C)). Bars are showing mean ± SEM. No significant effect of the R12C mutation on the relative distribution of SHANK3 clusters between spines and dendrites is found. The L68P mutation caused a significant increase in dendritic SHANK3 clusters (Kruskal-Wallis ANOVA with Dunn’s post hoc test: p(WT/R12C)=0.42; p(WT/L68P)=0.04 and p(R12C/L68P)=0.93 at p=95%). (E) Line profile analysis of the SHANK3 distribution between spines and dendrites (WT: 12 cells from four independent cultures, R12C: 11 cells from four independent cultures, L68P: 12 cells from five independent cultures). Bars are showing the mean as well as individual data points. No differences in the mean SHANK3 intensity ratio between spines and dendrites are found (one-way ANOVA with Bonferroni multiple comparisons test: p(WT/R12C)=1 and p(WT/L68P)=0.83 at p=95%). (F) Quantification of bassoon (bsn)/SHANK3 and SHANK3/bsn co-localization on dendritic clusters of neurons overexpressing GFP-SHANK3FL variants (WT: n = 11 cells from three independent cultures; R12C: n = 8 cells from three independent cultures; L68P: n = 10 cells from three independent cultures). No significant differences between genotypes are found (Kruskal-Wallis ANOVA with Dunn’s post hoc test: SHANK3/bsn co-localization: p(WT/R12C)=1; p(WT/L68P)=1; and p(R12C/L68P)=1 at p=95%; bsn/SHANK3 co-localization: p(WT/R12C)=1; p(WT/L68P)=1; and p(R12C/L68P)=1 at p=95%). Bars are showing the mean as well as individual data points per cell. (G) Quantification of homer/SHANK3 and SHANK3/homer co-localization on dendritic clusters of neurons overexpressing GFP-SHANK3FL variants (WT: n = 7 cells from two independent cultures; R12C: n = 12 cells from two independent cultures; L68P: n = 11 cells from two independent cultures). No significant differences between genotypes are found (Kruskal-Wallis ANOVA with Dunn’s post hoc test: SHANK3/homer co-localization: p(WT/R12C)=1; p(WT/L68P)=1; and p(R12C/L68P)=1 at p=95%; homer/SHANK3 co-localization: p(WT/R12C)=1; p(WT/L68P)=1; and p(R12C/L68P)=1 at p=95%). Bars are showing the mean as well as individual data points. (H) Representative images of GFP-SHANK3FL expressing neurons, co-stained for MAP2 and bassoon. The MAP2 signal was used as a mask to draw the outline of dendrites. Co-localization of GFP-SHANK3FL clusters with bassoon was analyzed within the MAP2 mask. (I) Representative images of GFP-SHANK3FL expressing neurons, co-stained for MAP2 and homer. Co-localization of GFP-SHANK3FL clusters with homer was analyzed within the MAP2 mask. WT = wild type.


