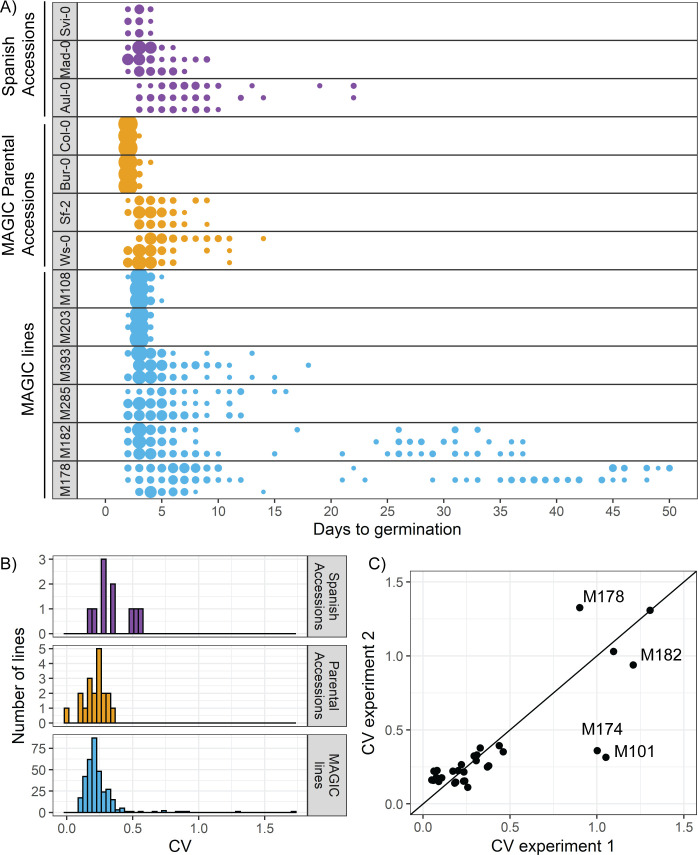
Figure 1. There is variation in variability in germination times in Arabidopsis.
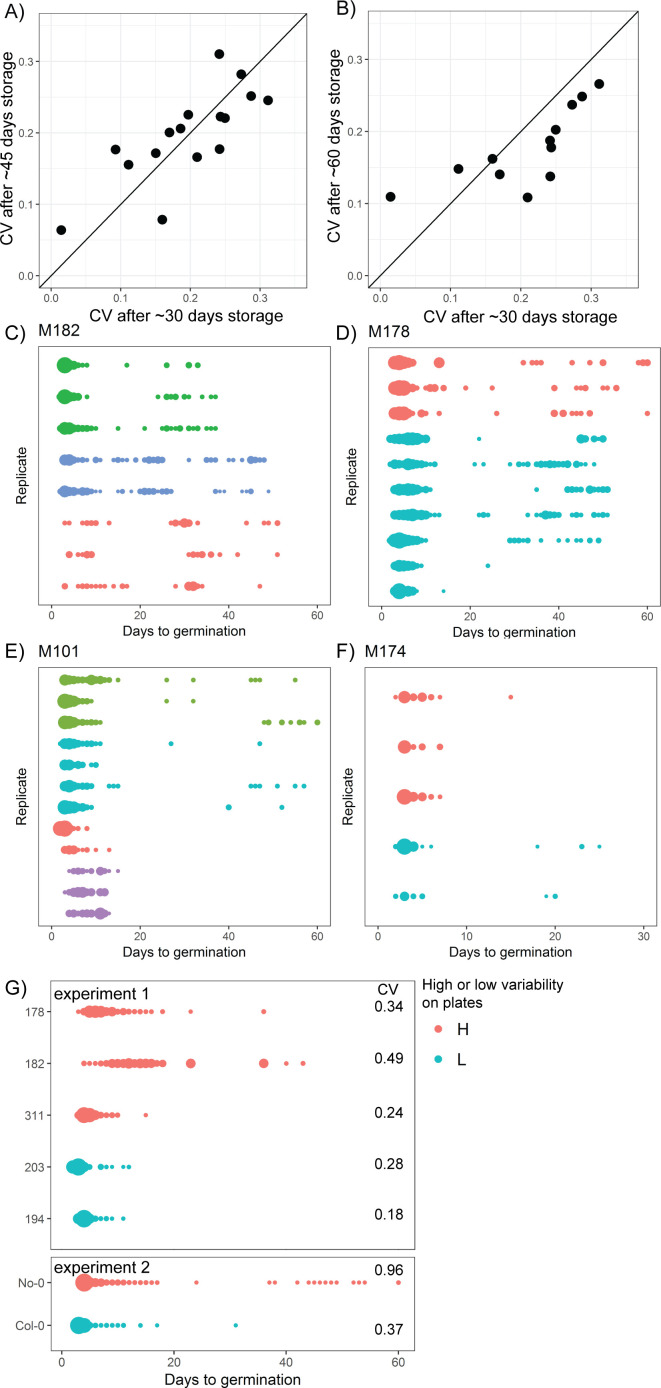
(A) Examples of distributions of germination time for natural accessions and MAGIC lines. Each row shows the germination time distribution of a seed batch from a different parent plant of a particular line, and colours represent whether the line is a Spanish accession (purple), MAGIC parental accession (yellow) or MAGIC line (blue). The size of the circles is proportional to the percentage of seeds sown that germinated on a given day. For the two groups of accessions (Spanish accessions and MAGIC parents), examples of the lowest and highest variability lines are shown. For MAGIC lines, examples are shown of low variability (top two lines); high variability, long-tailed (middle two lines) and very high variability bimodal (bottom two lines) lines. (B) Frequency distribution of coefficient of variation (CV) of germination times for 10 Spanish accessions (purple), the 19 parental natural accessions that were used to generate the MAGIC lines (orange) and 341 MAGIC lines (blue). In the majority of cases, the CV of a given MAGIC line is the mean of the CVs of three batches of seeds collected from separate parent plants. (C) CV of germination times for a subset of 32 MAGIC lines in two separate experiments. The batches of seeds for the two experiments were derived from different independently sown mother plants. The line shows y = x and is for visualisation purposes only (i.e., it does not represent a trend line). Figure 1—figure supplement 1 shows the level of reproducibility of germination time distributions across replicates, lengths of period of dry storage and sowing conditions. Figure 1—source data 1 contains source data for (A). Figure 1—source data 2 contains source data for (B). Figure 1—source data 3 contains source data for (C).


