. 2021 Jun 1;10:e59485. doi: 10.7554/eLife.59485

Figure 2. The full range of germination times can be found in individual siliques.

(A) Germination time distributions for a very high variability line, M178. Each row is the distribution obtained using a sample of pooled seeds from one plant, with different rows showing data from different mother plants. (B) As for (A) but each row represents the distribution obtained using seeds from a single silique. Single siliques were randomly sampled from parent plants, and single siliques sampled from seven parent plants are represented. (C) Individual siliques were cut in half, and seeds from the top and bottom halves (distal and proximal, furthest and closest to the mother plants’ inflorescence stems, respectively) were sown separately. Each row is the bottom and top half of a particular silique. Half siliques sampled from two parent plants are represented. Seeds from whole plants, single siliques and half siliques were obtained and sown in different experiments. The size of the circles is proportional to the percentage of seeds that were sown that germinated on a given day. Figure 2—figure supplement 1 shows examples for other MAGIC lines plus an experimental repeat and statistical analysis. Figure 2—source data 1 contains source data for (A). Figure 2—source data 2 contains source data for (B). Figure 2—source data 3 contains source data for (C).

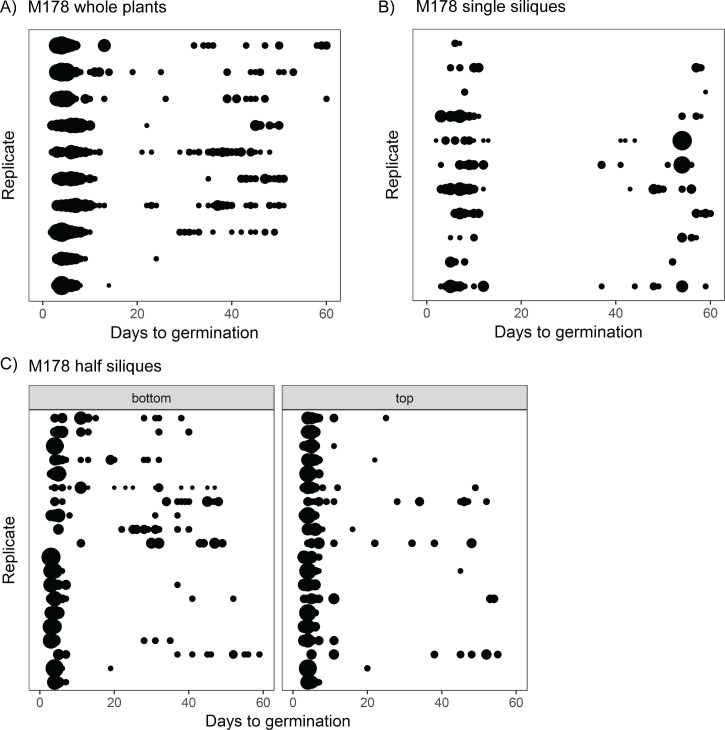
Figure 2—source data 1. Figure2_A_M178WholePlant.
Figure 2—source data 2. Figure2_B_M178SingleSiliques.
Figure 2—source data 3. Figure2_C_M178HalfSiliques.

Figure 2.

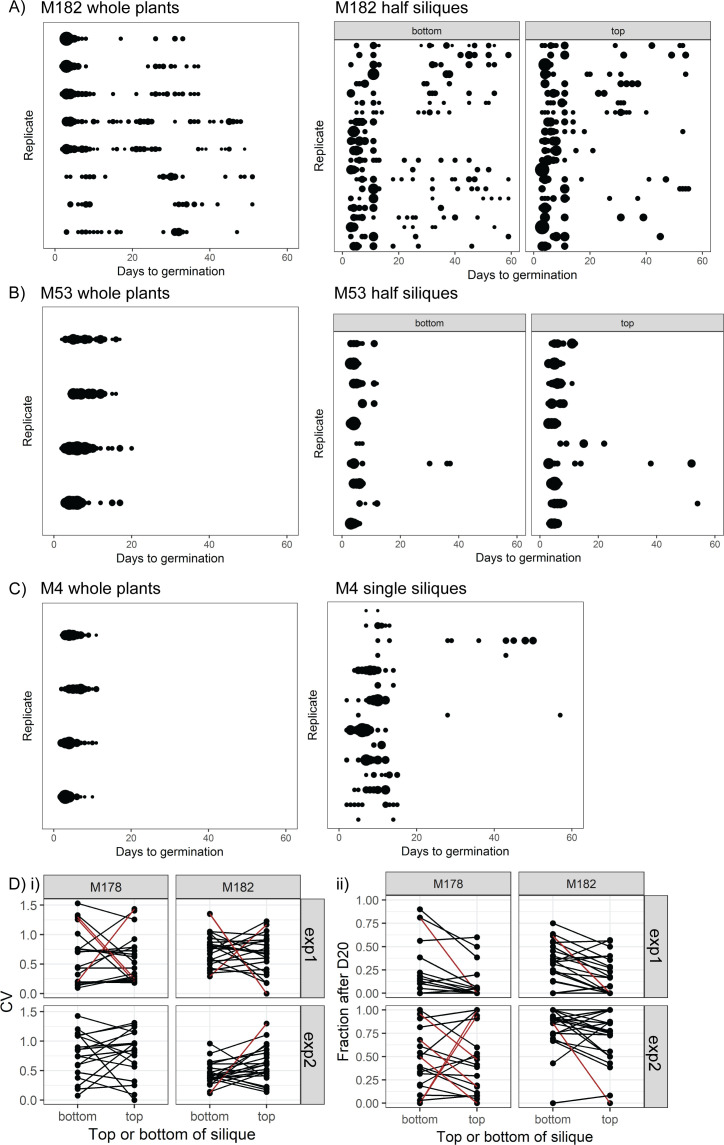
Figure 2—figure supplement 1. Germination time distributions for whole plants and single siliques for high variability lines.

Figure 2—figure supplement 1.

Germination time distributions for M182 (A) and M53 (B) for samples of seeds pooled from whole plants and for single siliques separated into top and bottom halves. Seeds from whole plants and half siliques were obtained and sown in different experiments. The siliques were randomly sampled from parent plants, and halved siliques from multiple plants are represented (three parent plants for M182 and ten for M53). For whole plants, each row is the distribution obtained using a sample of pooled seeds from one plant. For half siliques, each row is the bottom and top half of a particular silique (top half is that furthest from the mother plant's inflorescence stem). The size of the circles is proportional to the percentage of seeds that were sown that germinated on a given day. (C) As for (A) and (B) but for M4, showing whole siliques in the right-hand panel. Single siliques sampled from eight parent plants are represented. (D) Comparison of seed germination times between top and bottom halves of individual siliques for M182 and M178 MAGIC lines, collected and sown in two independent experiments (exp1 and exp2). Panels show the CV (panel i) and fraction of late germinating seeds (after day 20, panel ii) from the two halves of each assayed silique. Brown lines indicate significant differences from the null hypothesis (<5% false discovery rate). This was determined from bootstrap-based tests that accounted for the unequal number of seeds sown for each silique’s half. Note that even when there is a significant difference between the two silique halves, it is not consistently in the same direction. Figure 2—figure supplement 1—source data 1 contains source data for whole plant germination distributions in (A–C). Figure 2—figure supplement 1—source data 2 contains source data for M182 and M53 half silique germination distributions in (A) and (B). Figure 2—figure supplement 1—source data 3 contains source data for M4 single silique germination distributions in (C). Figure 2—figure supplement 1—source data 4 contains source data for (D).
Figure 2—figure supplement 1—source data 1. Figure2_figure supplement 1_AtoC_WholePlant.
Figure 2—figure supplement 1—source data 2. Figure2_figure supplement 1_A_B_M182_M53_halfSiliques.
Figure 2—figure supplement 1—source data 3. Figure2_figure supplement 1_C_M4_singleSilique.
Figure 2—figure supplement 1—source data 4. Figure2_figure supplement 1_D_TopBottomSiliqueComparison.