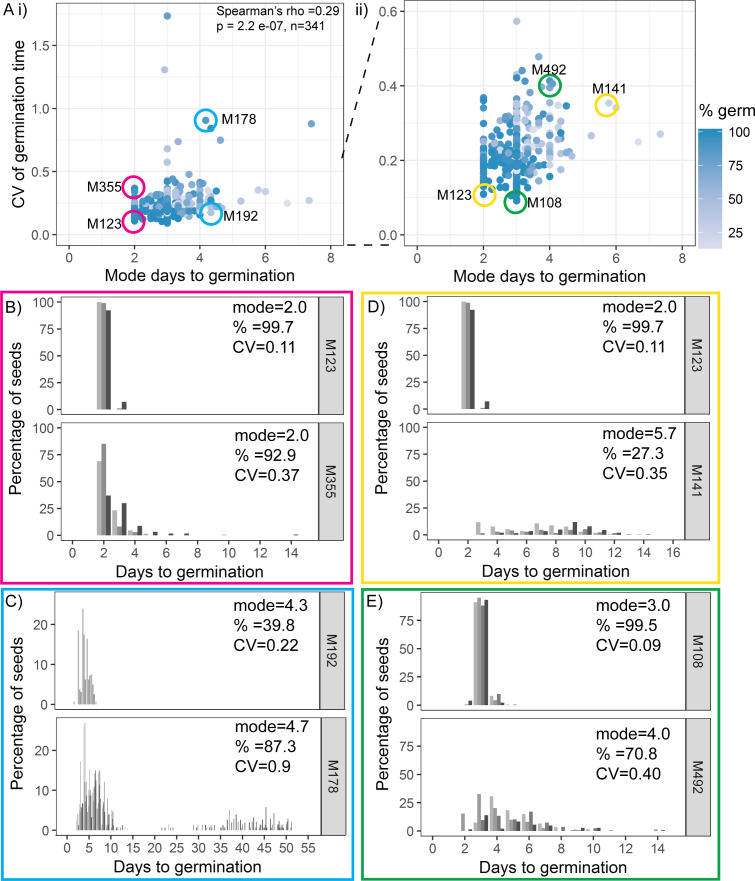
Figure 3. Variability is weakly coupled to modal germination time.
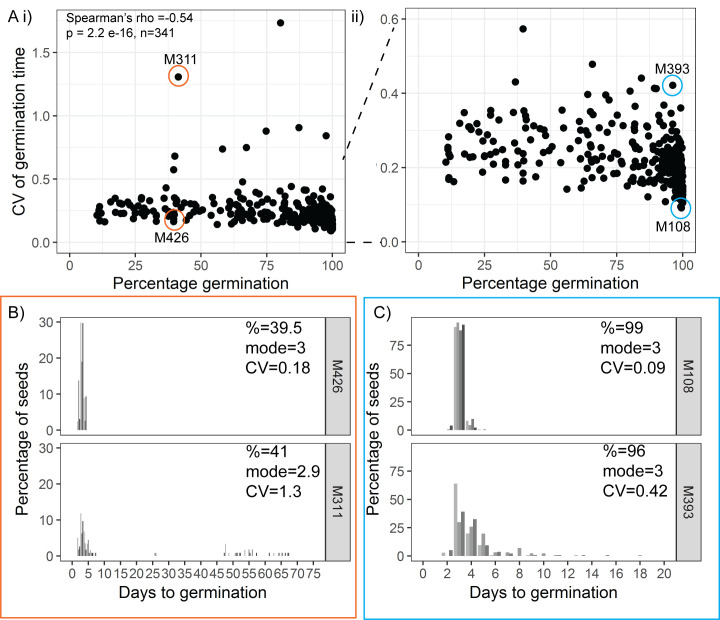
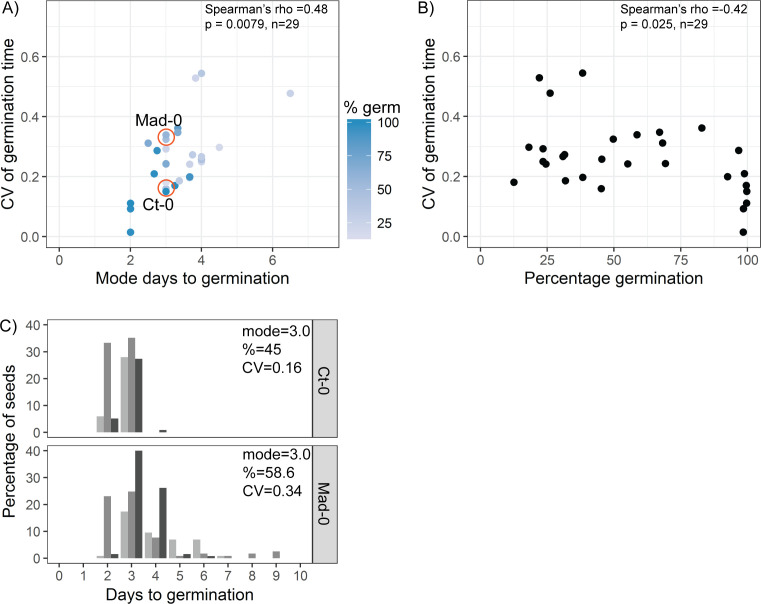
(A) Scatter plots of coefficient of variation (CV) of germination time versus mode days to germination for 341 MAGIC lines. Each point is a specific MAGIC line, and in the majority of cases, the CV and mode are mean values obtained from sowing one batch of seeds from each of three separate parent plants. Each point is shaded according to the percentage germination of the line (see scale bar). Coloured circles and labels indicate lines for which examples are shown in (B–E). (ii) is a zoom in of (i) including only lines with CV < 0.6. Spearman’s correlation for the full set of 341 MAGIC lines is indicated in (i). (B–E) Distributions of germination times for pairs of MAGIC lines. The colour of the box matches the coloured circles in (A). Lower CV lines are shown on top. Grey-coloured bars show the germination time distribution of seed batches from replicate mother plants. (B, C) Exemplar lines with the same mode days to germination but different CVs of germination time. (D, E) Lines that have different CVs and different mode days to germination. For each line, the mode days to germination, final percentage germination and CV of germination time are shown. Note that the x-axis scale differs between plots. Figure 3—figure supplement 1 shows the relationship between CV and percentage germination for MAGIC lines. Figure 3—figure supplement 2 shows relationships between CV, mode and percentage germination for natural accessions. Figure 3—source data 1 contains source data for (A). Figure 3—source data 2 contains source data for (B–E).


