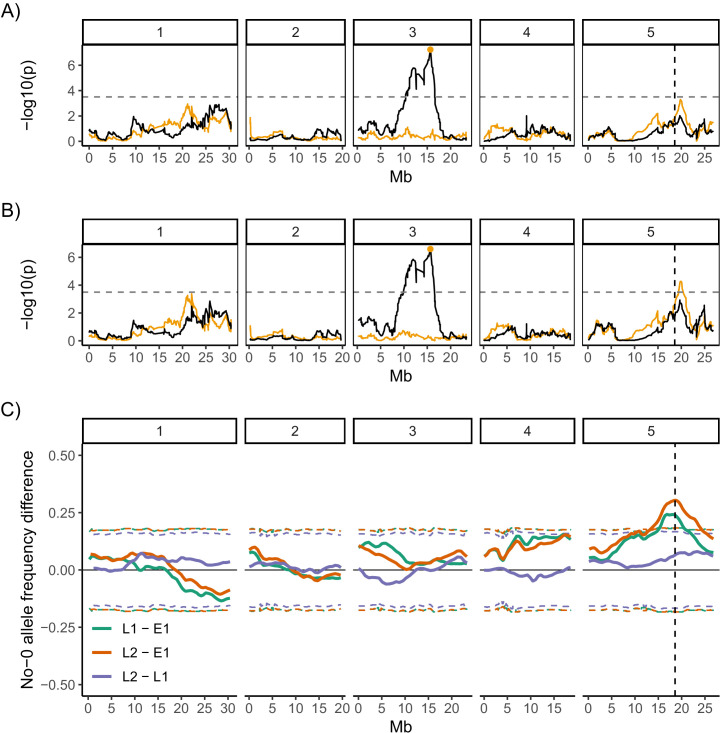
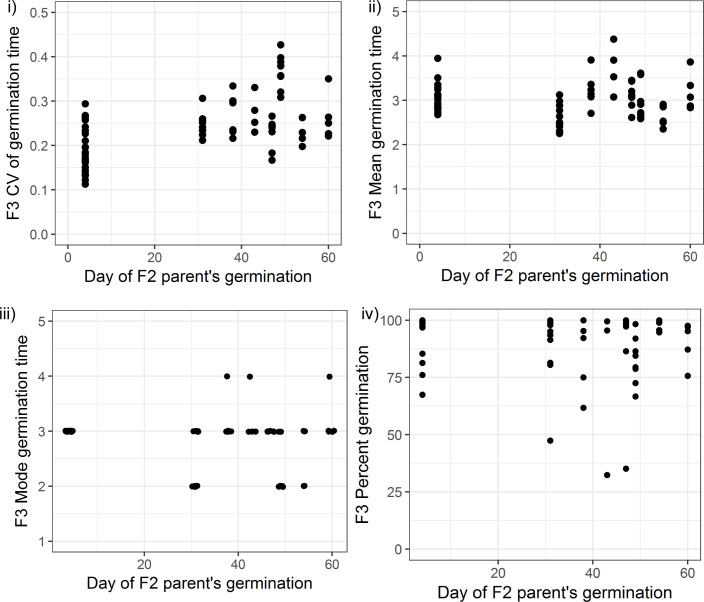
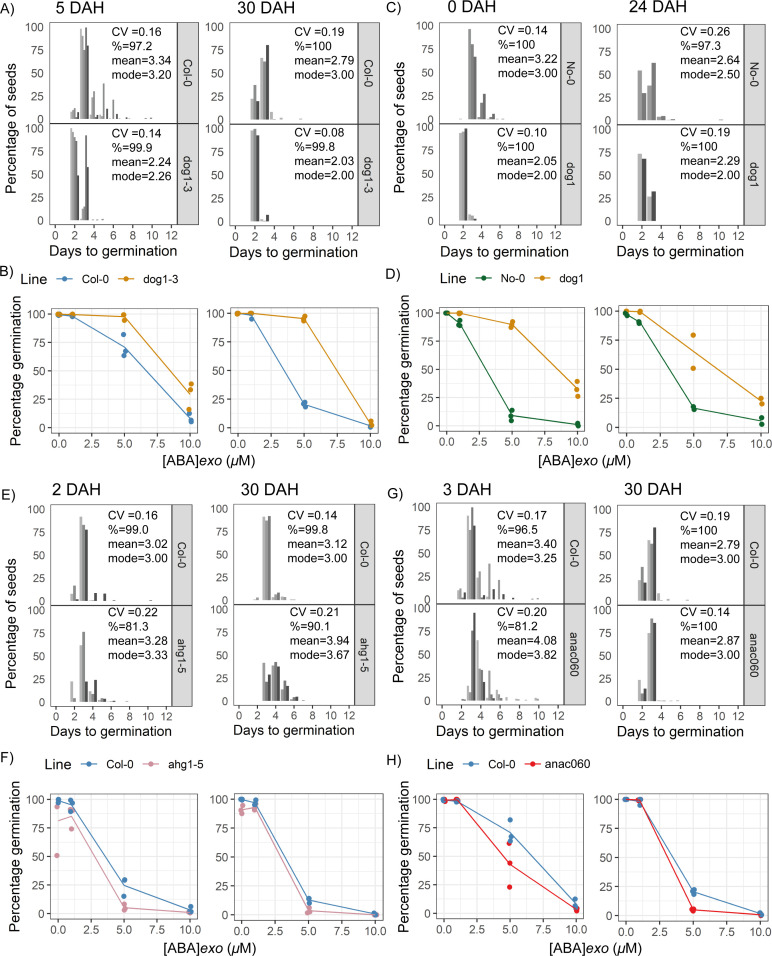
Figure 4. Quantitative trait locus (QTL) and bulk segregant mapping reveals two QTL underlying coefficient of variation (CV) of germination time.
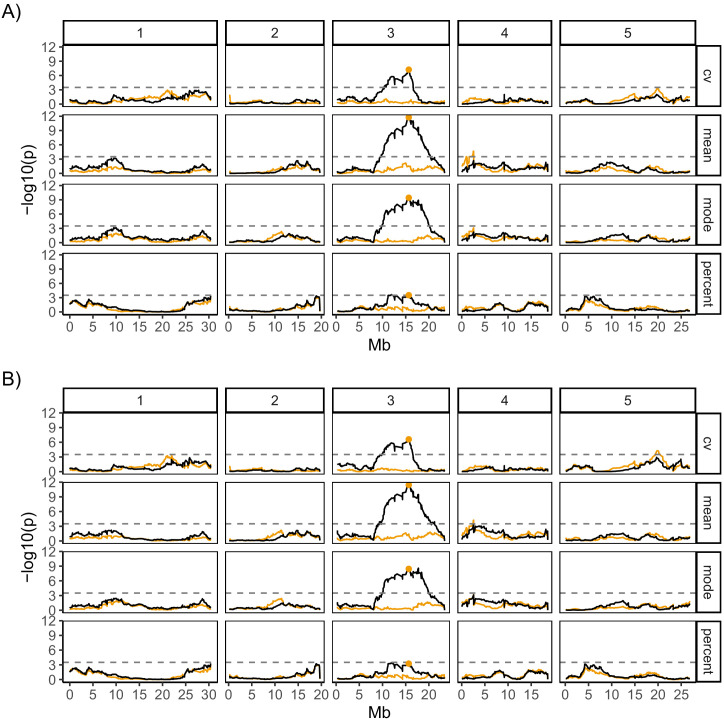
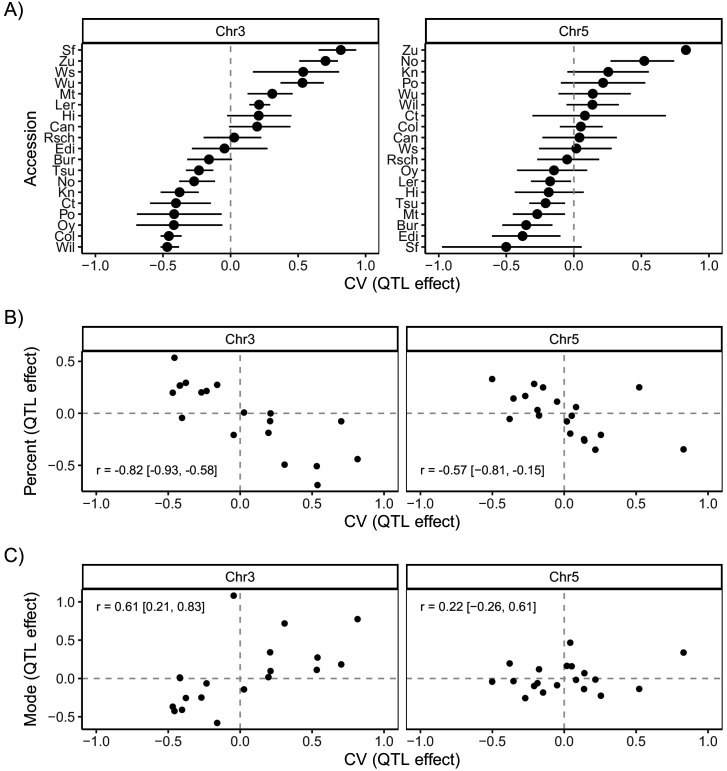
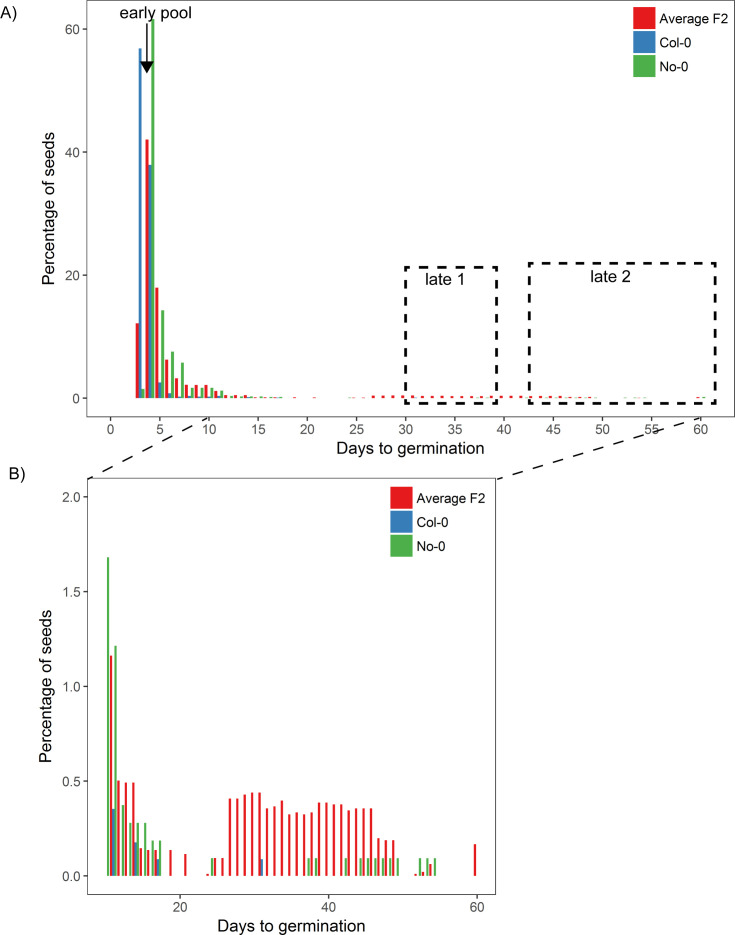
(A, B) Manhattan plots showing the QTL association results for each single nucleotide polymorphism (SNP) marker individually (black line) and for each marker when the Chr3 QTL SNP marker was added as a covariate (i.e. an additional variable) in the model (orange line). The orange line shows the variation in CV that is accounted for by each SNP across the genome when the variation that is explained by the Chr3 QTL SNP marker (orange point) is accounted for by adding it to the model as a covariate. The y-axis shows the p-values for the 1254 markers used, on a negative log10 scale, such that higher peaks indicate a stronger association between the region of the genome and CV. The numbered panels represent the five chromosomes of Arabidopsis. The horizontal dashed line shows a 5% genome-wide threshold corrected for multiple testing (based on simulations in Kover et al., 2009). The vertical dashed line indicates the DOG1 gene. (A) is for the full set of 341 MAGIC lines that was phenotyped and (B) excludes the eight bimodal lines with very high CV. Figure 4—figure supplement 1 shows QTL mapping for mean and mode days to germination and percentage germination. Figure 4—figure supplement 2 shows estimated effects of accession haplotypes on CV, mode and percentage germination. (C) Mapping QTL by bulk-segregant analysis using whole-genome pooled sequencing of F2 pools from a Col-0 × No-0 cross. One early and two late germinating F2 pools were sequenced. The plot shows the No-0 allele frequency differences between pairs of pools indicated in the legend (Figure 4—figure supplement 3 shows details of pool selections; E1, "early pool"; L1, "late one pool"; L2, "late two pool"). The horizontal dashed lines indicate the 95% thresholds based on simulating the null hypothesis of random allele segregation, taking into account the size of the sampled pools and the sequencing depth at each site (Magwene et al., 2011; Takagi et al., 2013). Positive values above the top line indicate enrichment for No-0 alleles, while negative values below the bottom line indicate enrichment for Col-0 alleles. As predicted, late germinating pools were enriched for the No-0 haplotype in the region of the Chr5 QTL. Here, the peak of association overlaps with the DOG1 gene (dashed vertical line). Figure 4—figure supplement 4 shows germination phenotypes of F3 seeds from Col-0 x No-0 F2 plants that themselves germinated early or late.

