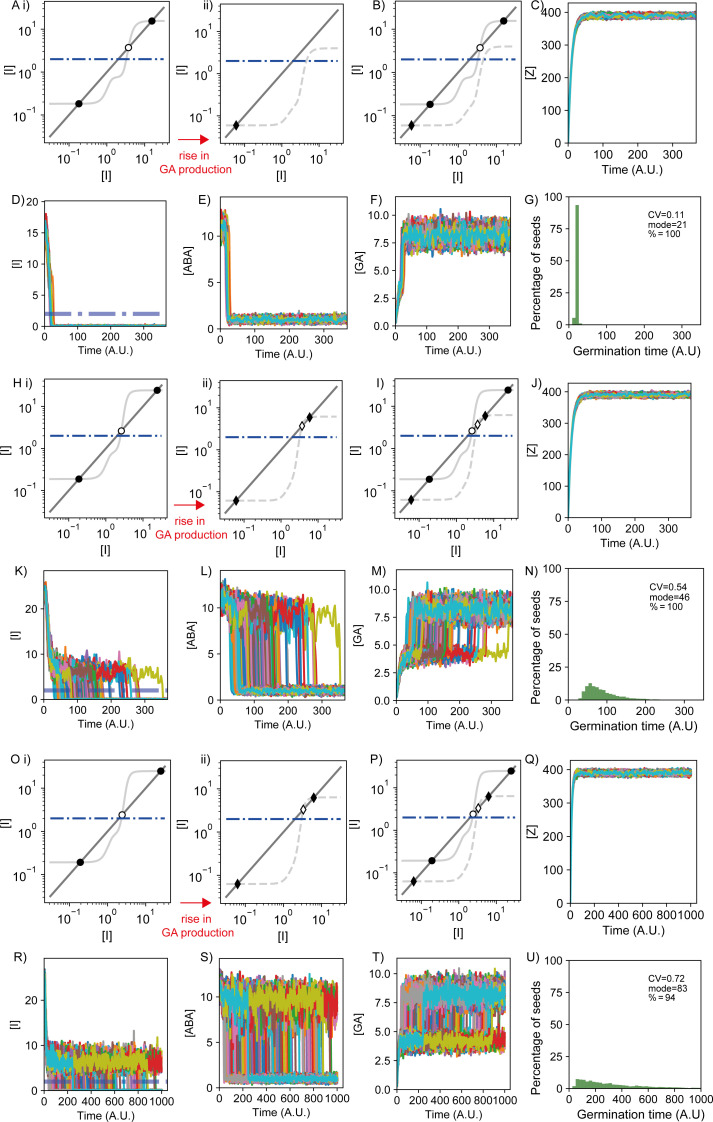
Modelling results showing representative behaviour of the model when it is in the monostable (
A–G) and two bistable scenarios (
H–U) after the rise of GA production (referred to as monostable and bistable scenarios for simplicity). (
H–N) show a bistable scenario where the non-germination steady state is less stable than the second bistable scenario shown in (
O–U). The three scenarios differ in the ABA threshold for integrator production, which modulates ABA sensitivity: the monostable scenario in (
A–
G) has the highest value of this parameter (
θI,ABA = 10), and therefore lowest ABA sensitivity, the first bistable scenario in (
H–
N) has an intermediate ABA sensitivity (
θI,ABA = 5.6) and the second bistable scenario in (
O–
U) has the highest ABA sensitivity (
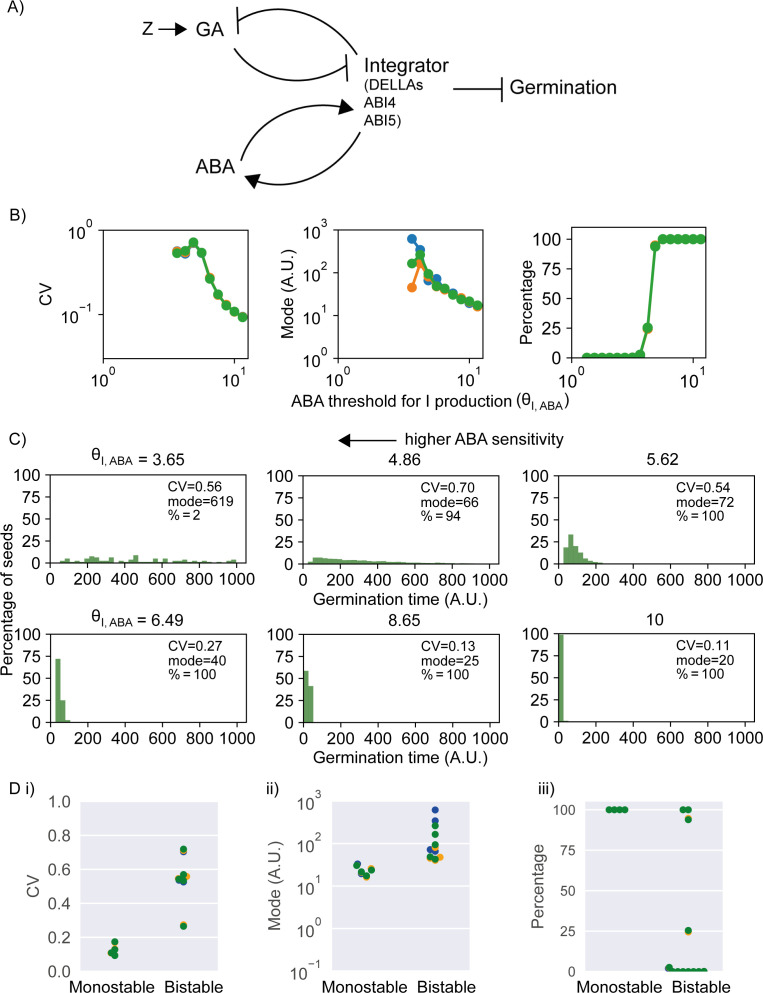
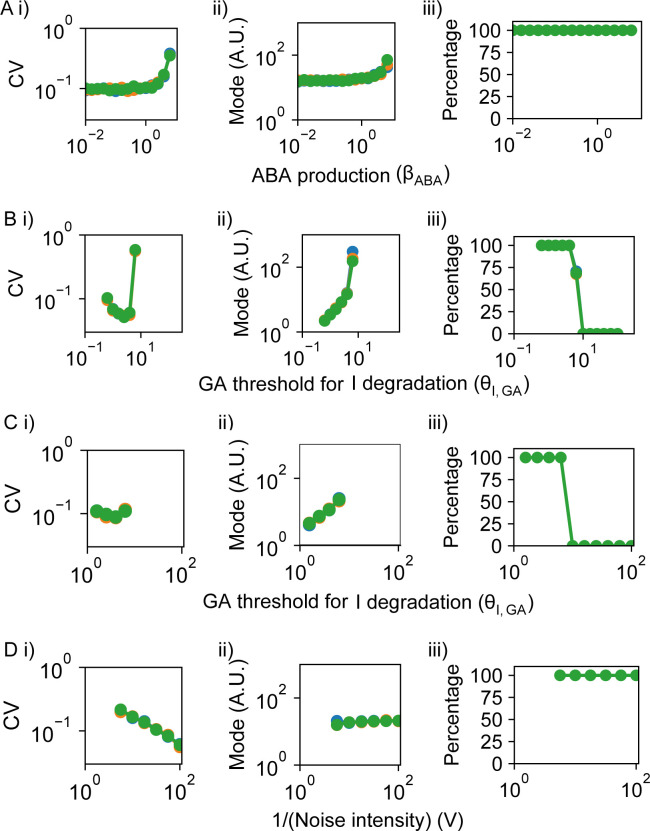
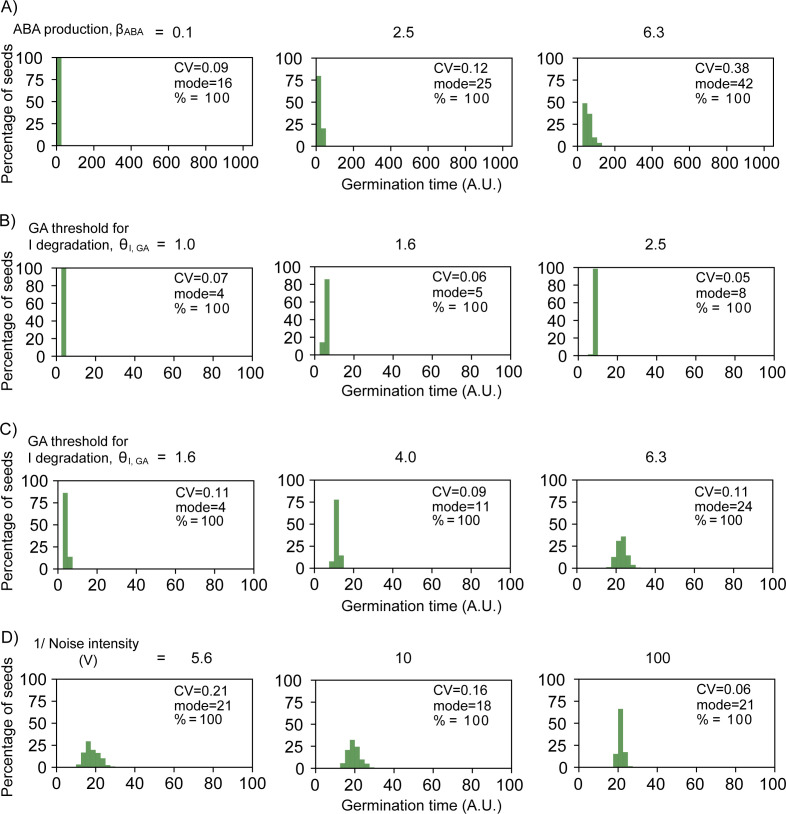
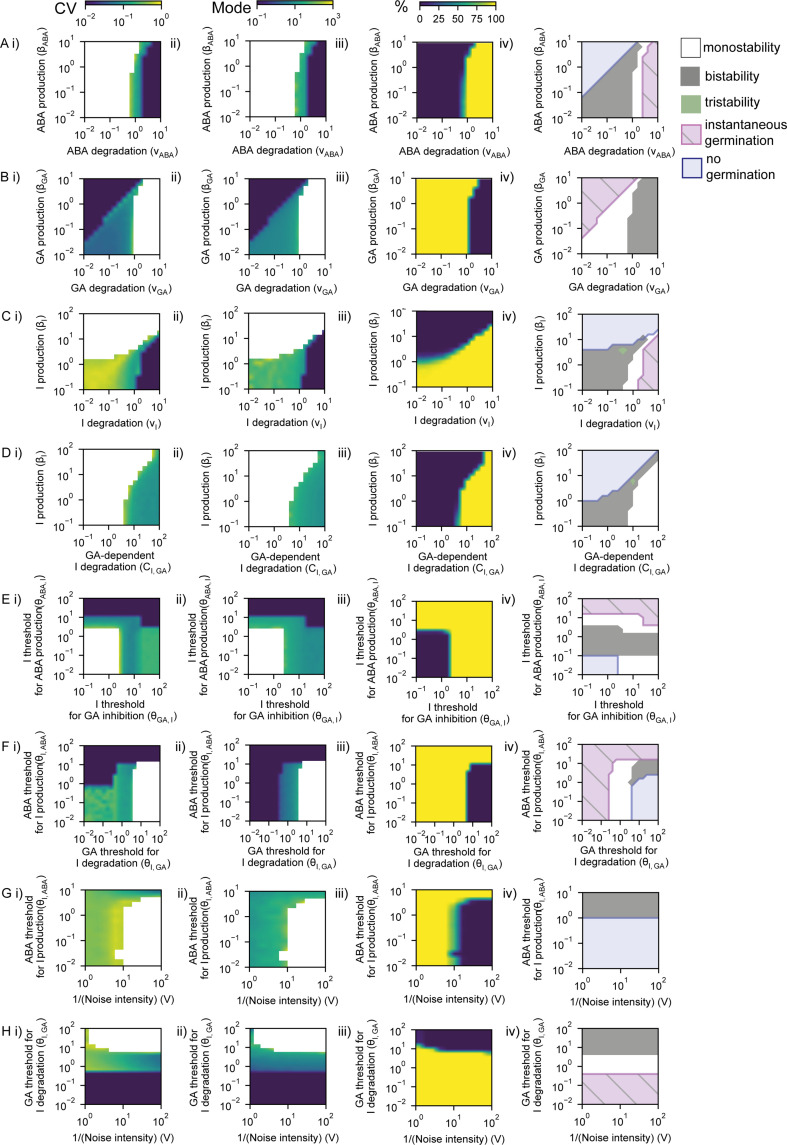
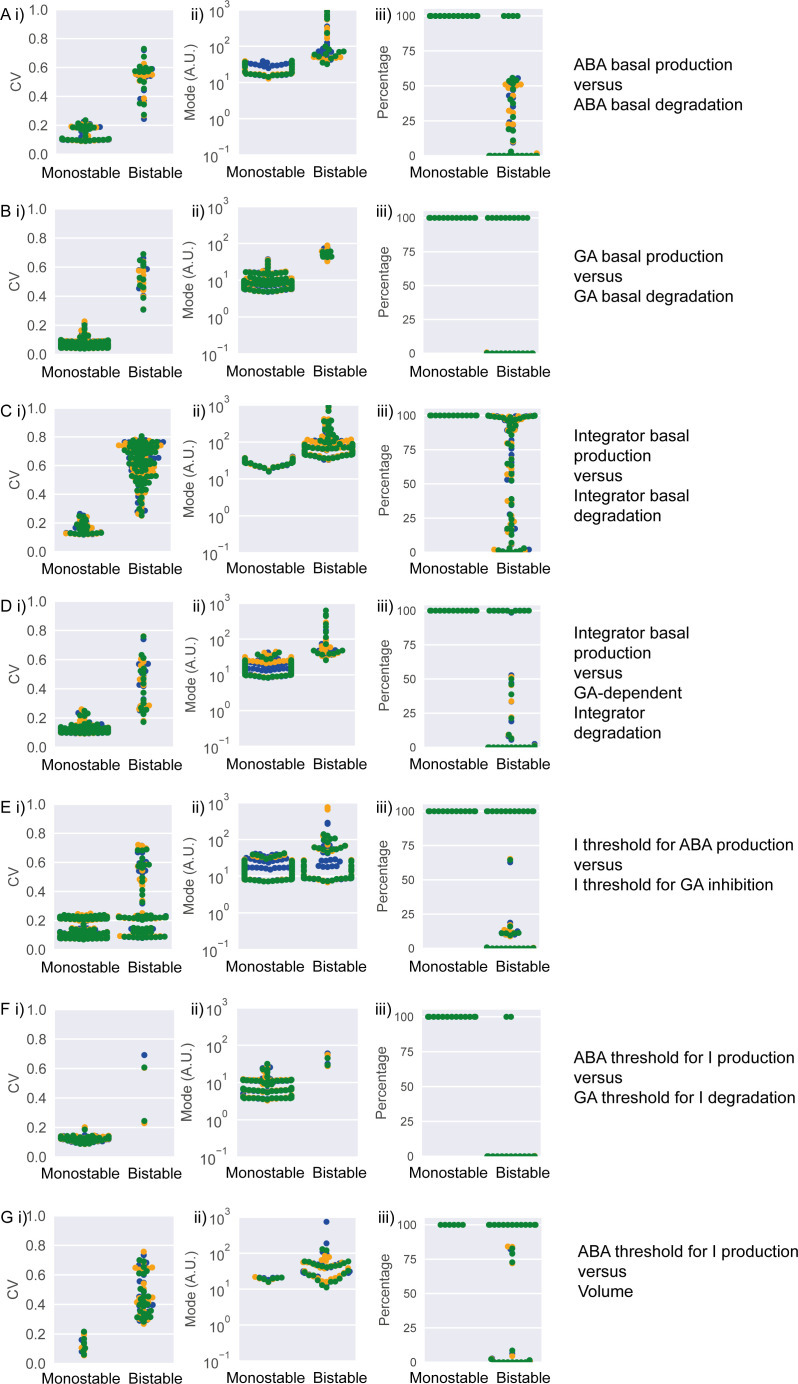
θI,ABA = 4.87). The bistable scenarios correspond to the grey region in the phase diagrams shown in
Figure 5—figure supplement 4, and the monostable scenario corresponds to the white regions. (
A, H, O) Results from nullcline analysis for the Integrator variable showing the steady states of the dynamics before (i) and after (ii) the GA production increase (see Materials and methods). In each panel, steady-state solutions are shown by the intersections between the dark grey line and the light grey line. Filled dots and diamonds represent the Integrator stable steady states before and after the GA production increase, respectively. Empty dots and diamonds represent unstable steady states. The dashed-dotted blue line illustrates the Integrator threshold below which germination happens. Before the increase of GA production, the modelled network exhibits a high Integrator stable steady state above the threshold (higher filled dot), representing a non-germinating state before sowing. We set this state as the initial condition of the simulation. For these parameter values, a lower Integrator stable solution below the germination threshold exists (lower filled dot), therefore representing a germination state, as well as an intermediate unstable Integrator solution (empty dot). Hence, bistability occurs for the Integrator variable before the increase of GA production. With the provided noise intensity for these simulations, none of the seeds is able to switch from the non-germination state to the germination state before the rise of GA production in the three scenarios (
A), (
H) and (
O) (see Materials and methods). (
Aii) In the monostable scenario after the rise in GA production, the increase in GA production leads to the disappearance of the non-germination state and the unstable steady state through a saddle node bifurcation; this makes the germination state the only possible stable state. (
Hii,
Oii) In the bistable scenarios after the rise in GA production, the non-germination state (high Integrator, high ABA and low GA) approaches the unstable steady state (empty dot), becoming less stable. In these cases, stochastic fluctuations enable the simulated seeds to cross the unstable steady state, reaching the germination state (low Integrator, low ABA and high GA), which becomes a more stable solution. (
B, I, P) Nullclines analyses shown in (
A), (
H) and (
O) subpanels, with the scenarios before and after the rise in GA production represented together. For each panel, the light grey solid line and dots show the case before the rise in GA production, and the light grey dashed line and diamonds show the case after the rise in GA production. (
C–F,
J–M,
Q–T) Time courses for the components of the model in example simulations. Different coloured lines represent different seeds. (
C, J, Q) Time courses of the concentration of the factor Z, which increases rapidly upon sowing and promotes GA production. (
D, K, R) Time courses of Integrator concentrations. Dashed-dotted blue lines show the threshold below which Integrator must drop for germination to occur. (
E, L, S) Time courses of ABA concentrations. (
F, M, T) Time courses of GA concentrations. (
G, N, U) Histograms of germination times, with values for coefficient of variation, mode and percentage germination of the distribution. Note that the x-axis range for the time courses and histograms is larger for (
Q–
U) due to the highly variable germination times in this scenario. The simulations representing the bistable scenarios show a transient in which the seeds can remain in a high Integrator state until the stochastic fluctuations cause them to switch to the low Integrator state. Conversely, in the monostable scenario, the seeds achieve the low Integrator state in a more direct manner. See Materials and methods for further details on parameters and numerical simulations.

