. 2021 Jun 1;10:e59485. doi: 10.7554/eLife.59485

Figure 6. Exogenous addition of abscisic acid (ABA) to high and low variability lines.

(A) Simulations of addition of increasing doses of exogenous ABA (x-axes), starting from a point in the parameter space that shows higher seed germination time variability (left) and lower variability (right) when no exogenous ABA is added. High variability in seed germination time is simulated with a lower value of the ABA threshold for I production (θI,ABA ) (i.e. higher ABA sensitivity) than low variability in seed germination time. Plots show the effects on the coefficient of variation (CV) (i), mean (ii), mode (iii) and percentage of seeds that germinated (iv) for the resulting germination time distributions. Each panel shows the result of five stochastic simulations for 4000 seeds, each plotted in a different colour. Parameter values for the high and low variability lines simulations are the same with the exception of the ABA threshold for I production (θI,ABA = 7 for the low variability lines and θI,ABA = 5.8 for the high variability lines). See Materials and methods for further simulation details and parameter values. (B) Experimental ABA dose response for six high variability MAGIC lines (left) and six low variability lines (five MAGIC lines plus Col-0) (right). (B) (i) shows mean CVs of individual lines for different exogenous ABA concentrations (means are of at least two independent experiments), (ii) as for (i) but for mean days to germination, (iii) mode days to germination and (iv) percentage germination. Treatments with ‘0’ μM are vehicle control treatments. Figure 6—figure supplement 1 shows exogenous addition of gibberellic acid (GA) in the model and experimentally to the high and low variability lines. Figure 6—figure supplement 2 shows simulated germination time distributions for selected concentrations of exogenous ABA and GA. Figure 6—figure supplement 3 shows the results of nullcline analysis in the presence of exogenous ABA and GA. Figure 6—figure supplement 4 shows the effects of exogenous ABA and GA on germination time distributions for example high and low variability lines. Figure 6—source data 1 contains source data for (B).

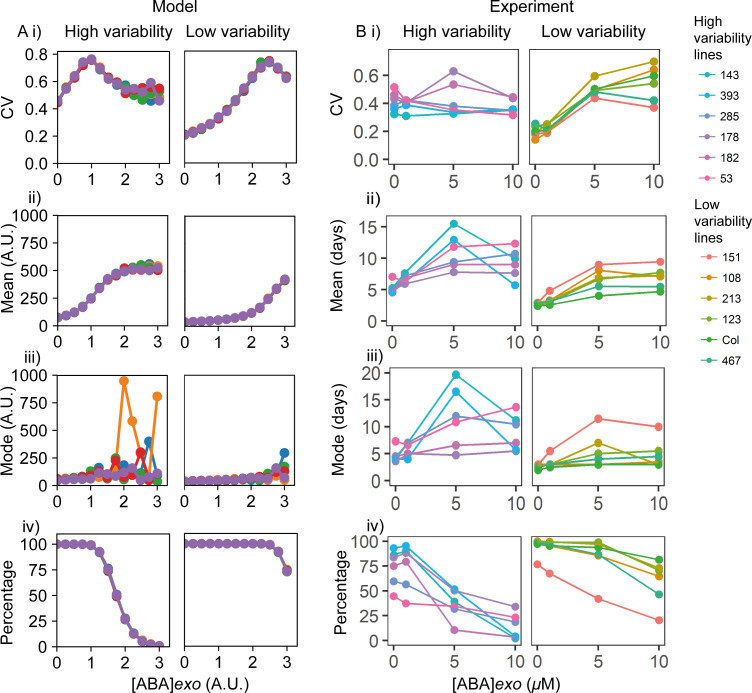
Figure 6—source data 1. Figure6_ABAGAdosesGermSummaries.

Figure 6.

Figure 6—figure supplement 1. Exogenous addition of gibberellic acid (GA) to high and low variability lines.

Figure 6—figure supplement 1.

(A) Simulations of addition of increasing doses of exogenous GA (x-axes), starting from a point in the parameter space that shows higher seed germination time variability (left) and lower variability (right) when no exogenous GA is added. As in Figure 6, high variability in seed germination time is simulated with a lower value of the abscisic acid (ABA) threshold for I production (θI,ABA) (i.e. high ABA sensitivity) than low variability in seed germination. Plots show the effects on the coefficient of variation (CV) (i), mean (ii), mode (iii) and percentage of seeds that germinated (iv) for the resulting germination time distributions. Each panel shows the result of five stochastic simulations for 4000 seeds, each plotted in a different colour. Parameter values for the high and low variability lines simulations are the same with the exception of the ABA threshold for I production (θI,ABA = 7 for the low variability lines and θI,ABA = 5.8 for the high variability lines). See Materials and methods for further simulation details and parameter values. (B) GA dose response for six high variability MAGIC lines (left) and six low variability lines (five MAGIC lines plus Col-0) (right). (Bi) shows mean CVs of individual lines for different GA concentrations (means are of at least two independent experiments, except for MAGIC lines 467 and 151 which have only one experiment), (ii) mean days to germination, (iii) mode days to germination and (iv) percentage germination. Treatments with ‘0’ μM are vehicle control treatments. Figure 6—figure supplement 2B shows simulated germination time distributions for selected concentrations of exogenous GA. Figure 6—figure supplement 3B shows the results of nullcline analysis in the presence of exogenous GA. Figure 6—figure supplement 4B shows the effects of GA on germination time distributions for example high and low variability lines. Figure 6—source data 1 contains source data for (B).
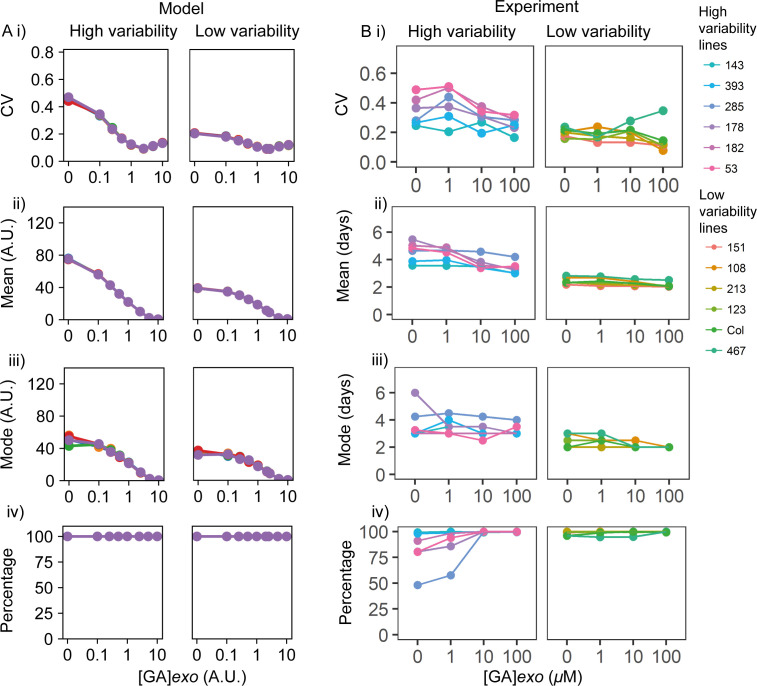
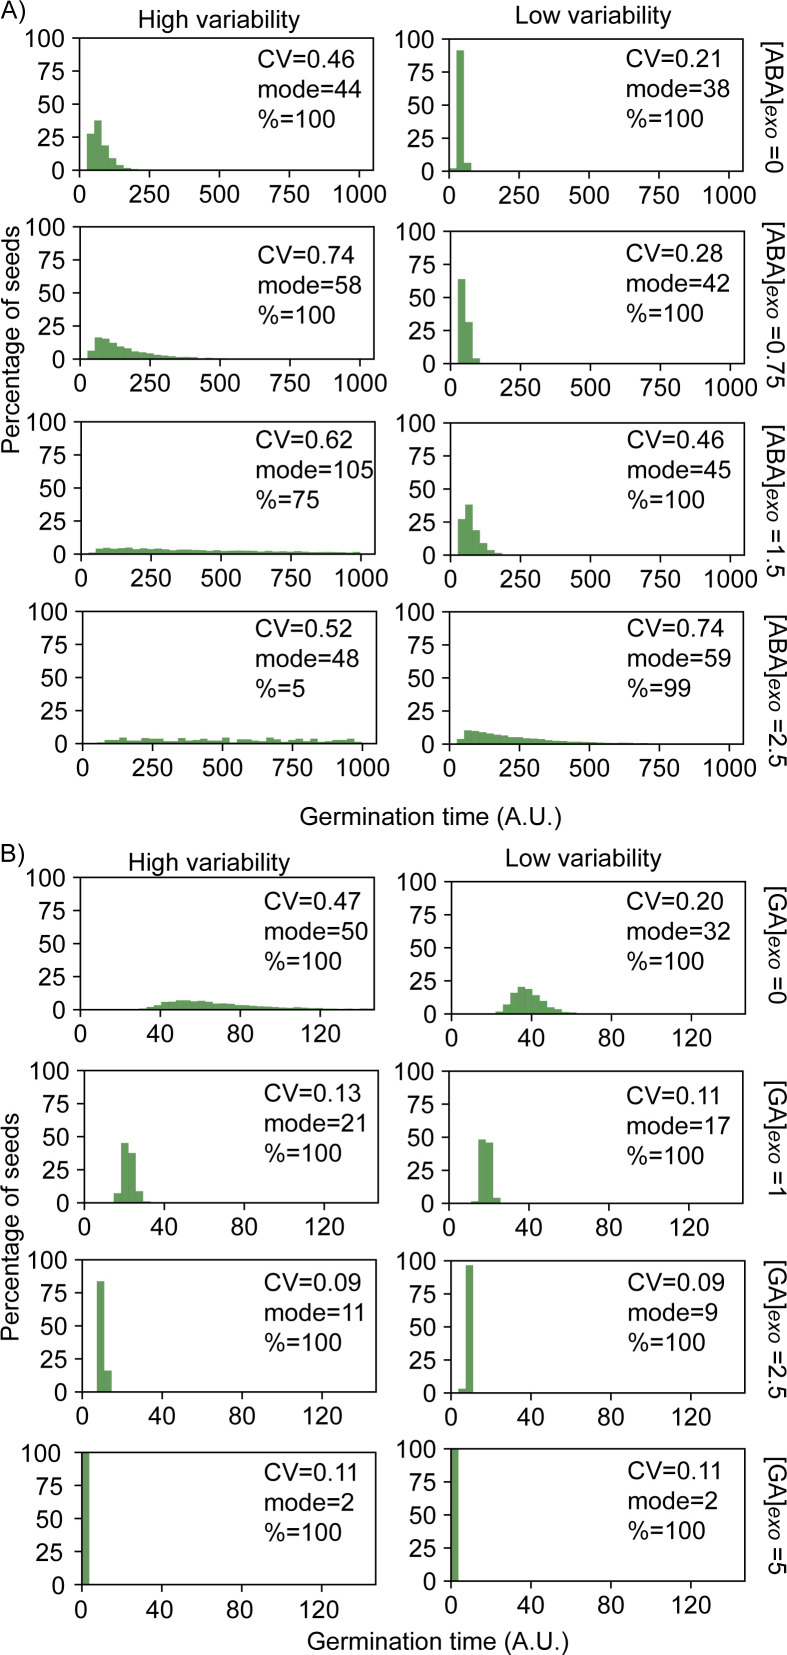
Figure 6—figure supplement 2. Simulated germination time distributions for a range of concentrations of exogenous abscisic acid (ABA) and gibberellic acid (GA).

Figure 6—figure supplement 2.

Simulation results of adding increasing concentrations of exogenous ABA (A) or GA (B), showing germination time distributions and the coefficient of variation (CV), mode and percentage germination for those distributions. Simulations were performed starting from a point in the parameter space that shows higher germination time variability (left) and lower germination time variability (right) when no exogenous ABA or GA is added. Results correspond to a subset of the same simulations from those presented in Figure 6 and Figure 6—figure supplement 1. See corresponding nullcline analyses for some of these panels in Figure 6—figure supplement 3.
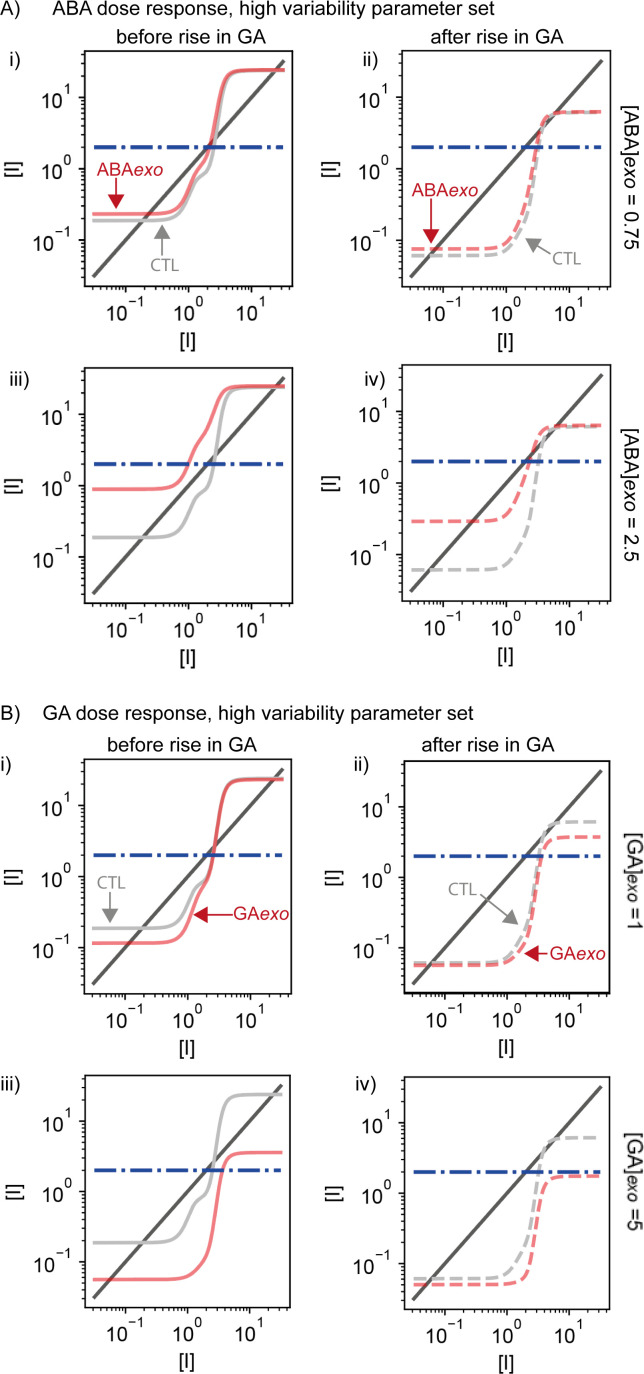
Figure 6—figure supplement 3. Results of nullcline analysis for abscisic acid (ABA) and gibberellic acid (GA) dose responses applied to the high variability parameter set.

Figure 6—figure supplement 3.

Plots are for example cases from Figure 6 and Figure 6—figure supplement 1. (A) Examples of nullcline analyses for two doses of exogenous ABA. Left-hand panels (i and iii) show the cases at the beginning of the simulations prior to the rise in basal GA production. Right-hand panels (ii and iv) show plots for after the rise in basal GA production. Light grey solid (i and iii) and dashed (ii and iv) lines show the control simulations without exogenous addition of ABA and red solid (i and iii) and dashed (ii and iv) lines show the simulations with addition of exogenous ABA (the level added is indicated on the right). Steady-state solutions are shown by the intersections of the dark grey solid line with the light grey or red lines. Dashed blue line is the threshold below which Integrator must drop for germination to occur. Exogenous application of ABA can enhance the stability of the non-germination state (see Materials and methods), making it more difficult to switch to the germination state, driving a very long-tailed or flat distribution of germination times (Figure 6—figure supplement 2A). Exogenous ABA also shifts the low Integrator germination steady state higher, closer to the threshold for germination (compare the intersections of dashed red and dashed grey lines with the solid grey line). (B) As for (A), but for the addition of exogenous GA. Exogenous application of GA can destroy bistability before and after the rise of GA production, making the germination steady state the only possible steady state. This allows seeds to germinate earlier, with less variability (Figure 6—figure supplement 2B).
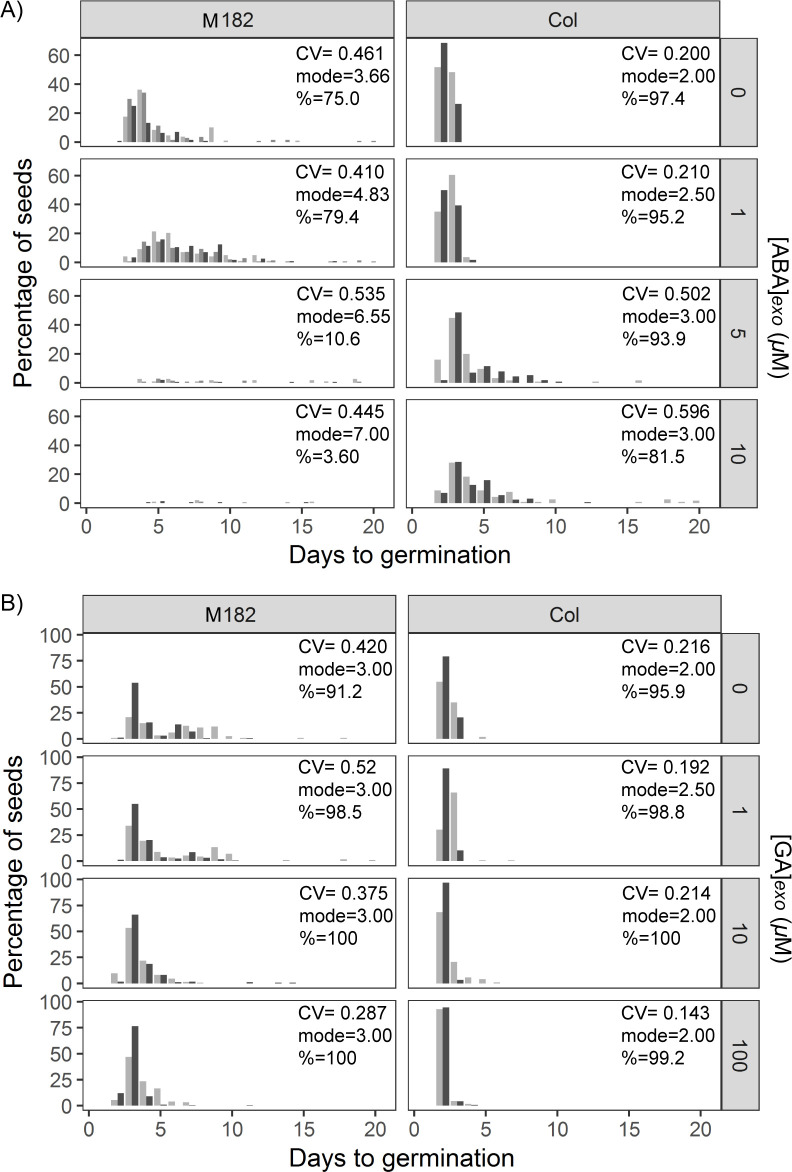
Figure 6—figure supplement 4. Effects of abscisic acid (ABA) and gibberellic acid (GA) on germination time distributions for example high and low variability lines.

Figure 6—figure supplement 4.

(A) Effect of increasing exogenous ABA concentration on the distribution of germination times for the high variability MAGIC line, M182 (left panels), and the low variability accession, Col-0 (right panels). Plots show the percentage of all seeds that were sown, which germinated on a given day. Horizontal rows of panels show increasing concentrations of ABA (see labels on the right). Shades of grey indicate experimental replicates (at least two for each genotype). (B) As for (A), but for exogenous GA. Figure 6—figure supplement 4—source data 1 contains source data for (A) and (B).
Figure 6—figure supplement 4—source data 1. Figure6_FigureSupplement4_ColM182_ABA_GA.