. 2021 May 4;10:e58523. doi: 10.7554/eLife.58523

Figure 1. Behavioral assay for freely moving olfactory search.

(A) Diagram of experimental chamber where mice are tracked by an overhead camera while performing olfactory search. (B) Top: nose and head positions are tracked using red paint at the top of the head. Sniffing is monitored via an intranasally implanted thermistor. Bottom: example of sniffing overlaid on a trace of nose position across a single trial. (C) Diagram of trial structure. Initiation. Mice initiate a trial via an initiation poke (gray oval). Search. Odor is then released from both odor ports (gray rectangles) at different concentrations. Outcome. Mice that cross the decision line (red) on the side delivering the higher concentration as tracked by the overhead camera receive a reward at the corresponding water port (blue ovals). (D) Colormaps of average odor concentration across ~15 two-second trials captured by a 7 × 5 grid of sequential photoionization detector recordings. Rows represent side of stimulus presentation (left or right). Odor concentrations beyond the decision line were not measured. (E) Comparison of sniff recordings taken with an intranasally implanted thermistor and intranasally implanted pressure cannula. These are implanted on the same mouse in different nostrils. Top: example trace of simultaneous pressure cannula (blue) and thermistor (red) recordings with inhalation points (as detected in all future analyses) overlaid on the traces in their respective colors. Bottom left: histogram of peak latencies (pressure inhalation onset – thermistor inhalation onset). 14/301 inhalations (4.7%) were excluded as incorrect sniff detections. These were determined as incorrect because they fell more than 2 standard deviations outside the mean in peak latency (mean = 1.61585 ms, SD = ±14.93223 ms). Bottom right: peak latencies, defined as the difference between pressure inhalation onset and thermistor inhalation onset, plotted against instantaneous sniff frequency.

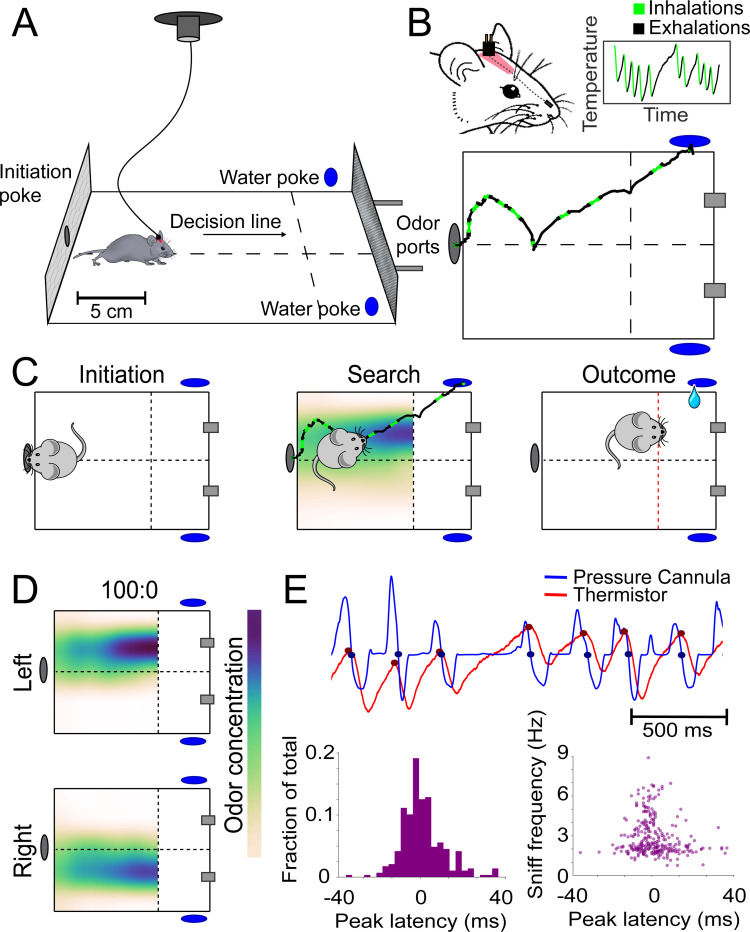
Figure 1.

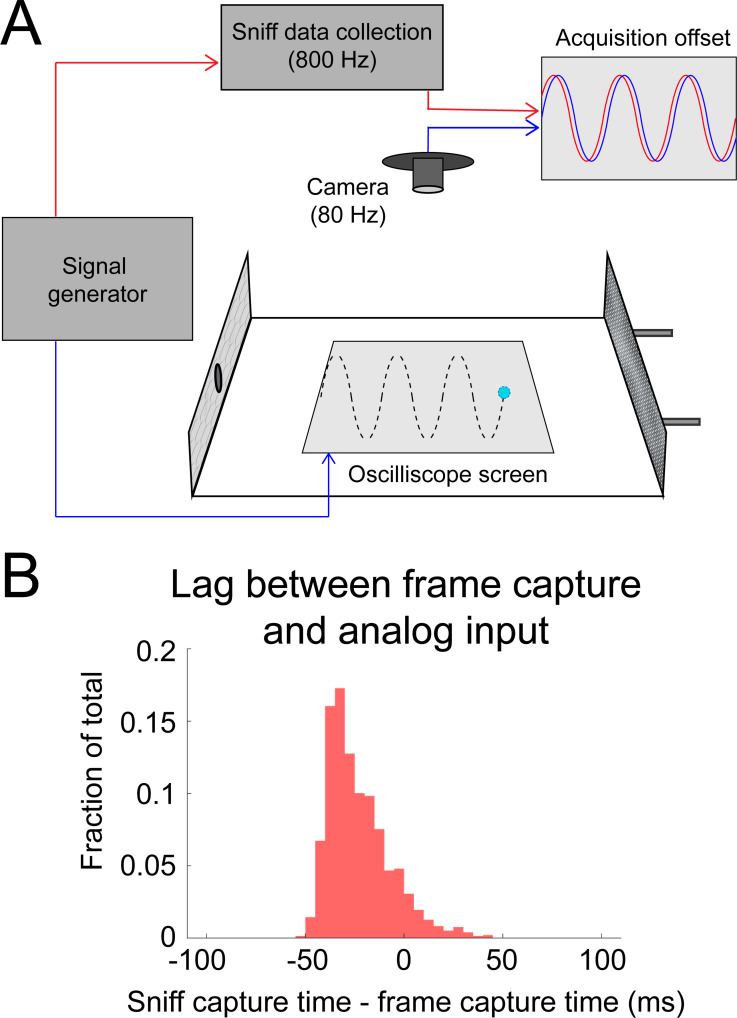
Figure 1—figure supplement 1. Calibrating alignment of video frames with sniff signal.

Figure 1—figure supplement 1.

(A) Sinusoidal signals (5, 8, 10, and 15 Hz) were simultaneously sent to the analog input channel (used to capture sniffing) and to a phosphor-display oscilloscope (Tektronix). The display of the oscilloscope was reflected by mirrors to allow it to be video-captured inside the behavioral arena. (B) The timing relationship is given by the lag between peaks in the analog input channel and the vertical peaks in the position of the oscilloscope trace. Analog input led video frames by 23.5 ± 15.7 ms (mean ± sd; approximately two frames at 80 frames/s).
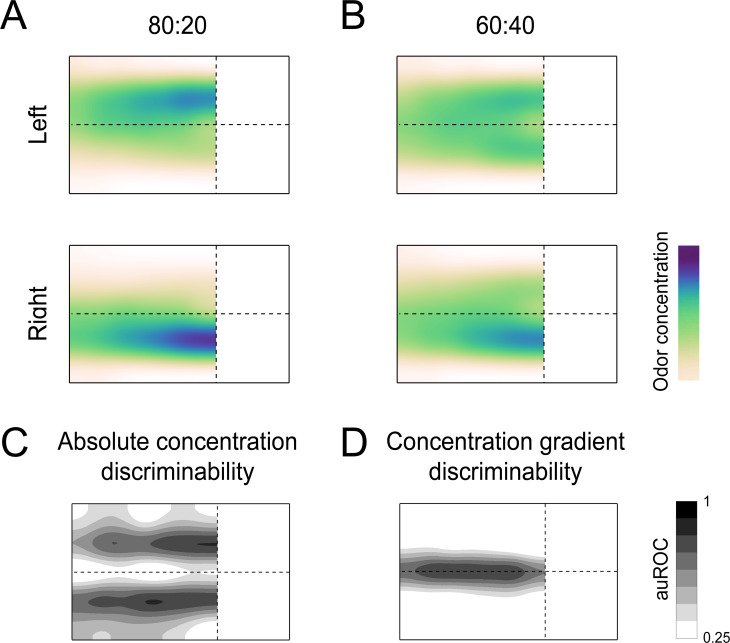
Figure 1—figure supplement 2. Characterizing the odor stimulus conditions.

Figure 1—figure supplement 2.

(A) Colormaps of average odor concentration across ~15 two-second trials captured by a 7 × 5 grid of sequential photoionization detector (PID) recordings. -- Each row represents trial type (left correct or right correct). 80:20 odor condition (see Materials and methods: behavioral training: 80:20). (B) Same as (A), for the 60:40 odor condition (see Materials and methods: interleaved: 60:40). (C) Absolute concentration discriminability map based on PID recordings (see Materials and methods). Darker shades indicate regions where absolute concentrations are most discriminable according to ROC analysis (see Methods: Mapping the Olfactory Environment). Essentially, these regions downwind of the odor ports have the largest differences in absolute concentration between left and right trials. (D) Concentration gradient discriminability map based on PID recordings. Darker shades indicate regions where odor concentration gradient angles are most discriminable according to ROC analysis. Essentially, this region around the lateral midline of the arena has the largest differences in concentration gradient between left and right trials.