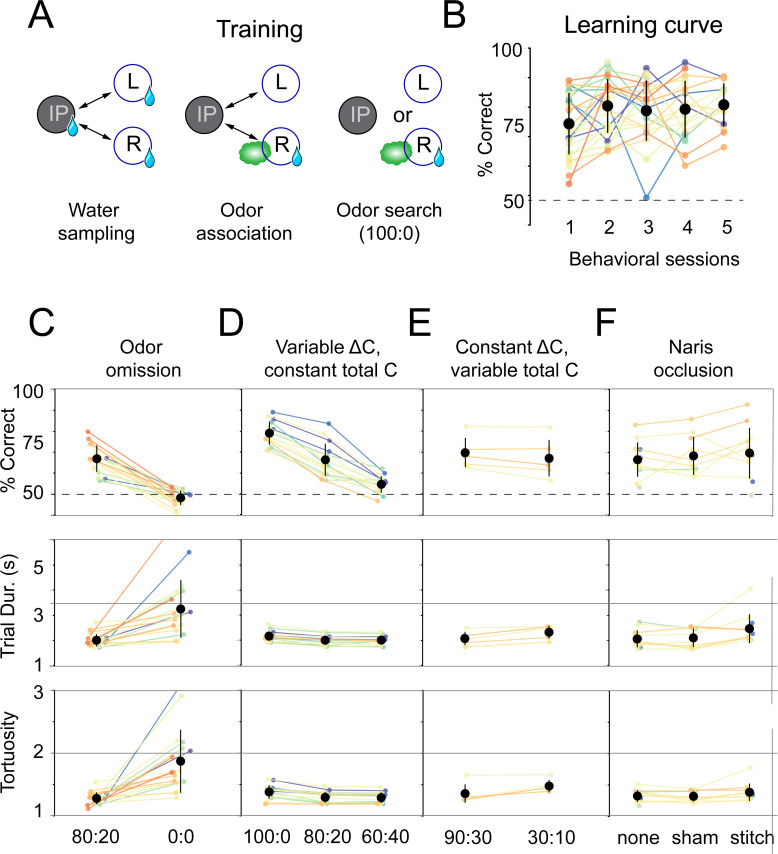
Figure 2. Mice use concentration gradient cues in turbulent flow to perform search.
(A) Initial training steps. Water sampling. In this task, mice alternate in sequence between the initiation, left, and right nose pokes to receive water rewards. Odor association. Next, mice run the alternation sequence as above without water rewards released from the initiation poke, making its only utility to initiate a trial. Further, odor is released on the same side of water availability to create an association between odor and reward. Odor search. Here, mice initiate trials by poking the initiation poke. Odor is then randomly released from the left or right odor port. Correct localization (see Figure 1C, decision line) results in a water reward and incorrect is deterred by an increased inter-trial interval (ITI). (B) Performance curve across sessions for the odor search (100:0) training step (n = 26). (C–F) Session statistics for four different experiments. Each colored line is the average of an individual mouse across all sessions, black points are means across mice, and whiskers are ±1 standard deviation across mice. Top: percent of correct trials. Middle: average trial duration. Bottom: average path tortuosity (total path length of nose trajectory/shortest possible path length). (C) Odor omission. The 80:20 concentration ratio (Figure 1) and odor omission (0:0) conditions randomly interleaved across a session. Data shown includes all sessions for each mouse (n = 19). (D) Variable ΔC, Constant |C|. Three concentration ratio conditions (100:0, 80:20, 60:40) randomly interleaved across a session. Data shown includes all sessions for each mouse (n = 15). (E) Constant ΔC, Variable |C|. Concentration ratio conditions 90:30 and 30:10 randomly interleaved across a session (n = 5). Data shown for first session only. (F) Naris occlusion. 80:20 sessions for mice with no naris stitch, a sham stitch that did not occlude the nostril, and a naris stitch that occluded one nostril (n = 13). Data shown includes all naris occlusion sessions even if the mouse did not perform under every experimental condition.


