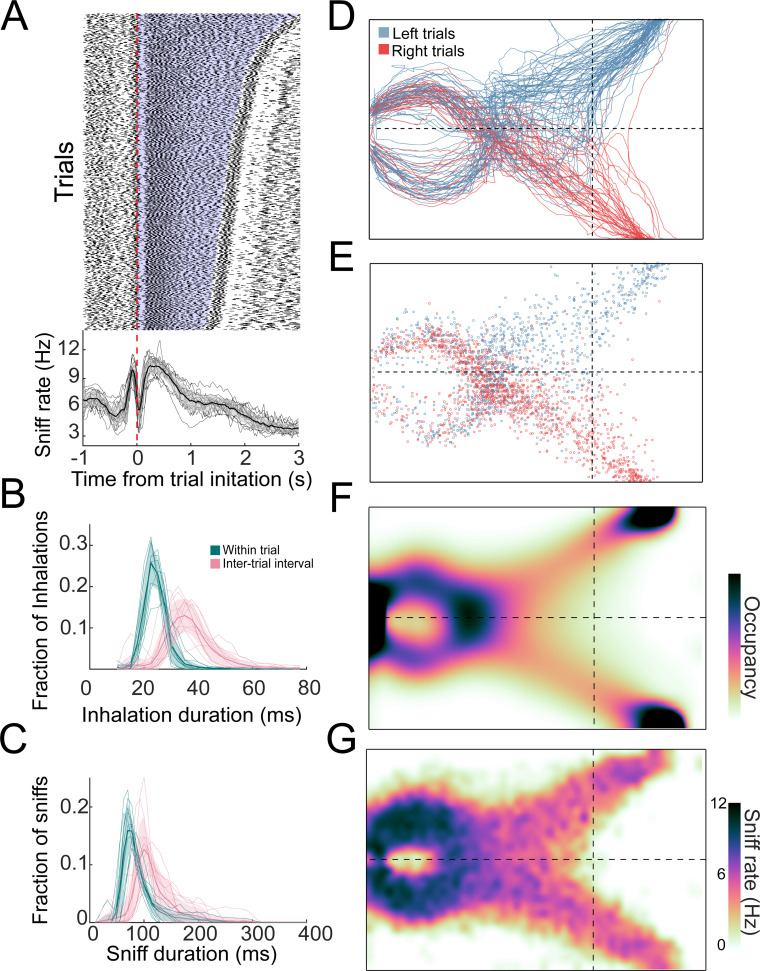
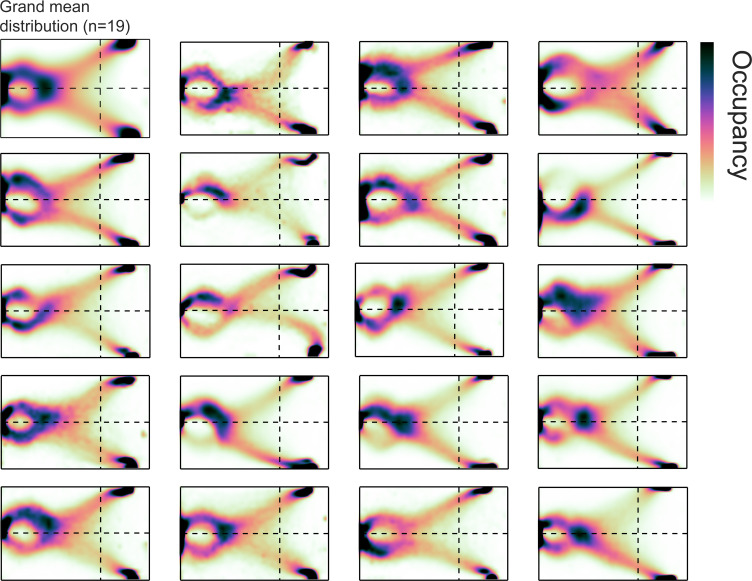
Figure 3. Distributions of sniffs and nose positions during search task.
(A) Above: sniff raster plot for three sessions. Each black point is an inhalation, each row is a trial aligned to trial initiation (dashed line). Rows are sorted by trial length. Blue region represents trial initiation to trial end. Below: mean instantaneous sniff rate across all trials for all mice aligned to time from trial initiation. Thin lines are individual mice, the thick line is the mean across mice, and shaded region is ±1 standard deviation. (B) Histogram of inhalation duration time across all mice (n = 11). Thick lines and shaded regions are mean and ±1 standard deviation, thin lines are individual mice. Green: within-trial sniffs; pink: inter-trial interval sniffs. (C) Histogram of sniff duration time across all mice (n = 11). (D) The nose traces of each trial across a single session, colored by chosen side. (E) Location of all inhalations across a single session, colored by chosen side. (F) Two-dimensional histogram of occupancy (fraction of frames spent in each 0.5 cm² bin). Colormap represents grand mean across mice (n = 19). (G) Grand mean sniff rate colormap across mice (n = 11).


