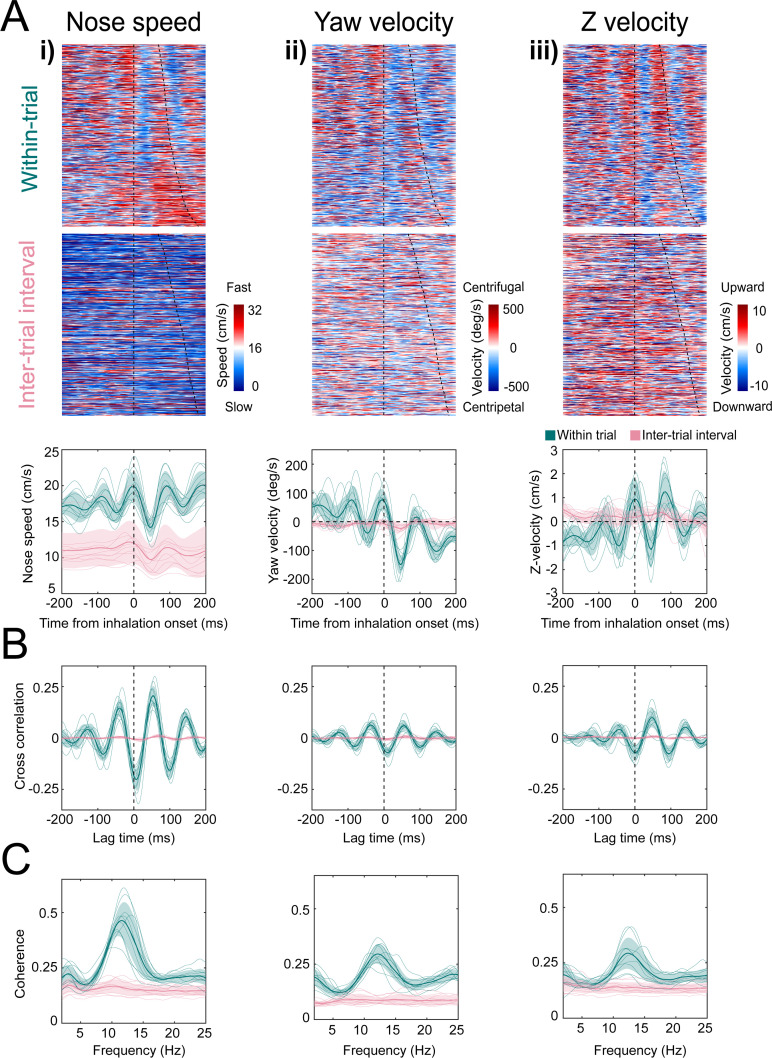
Figure 5. Kinematic rhythms synchronize with the sniff cycle selectively during olfactory search.
(i–iii) Nose speed, yaw velocity, and Z-velocity, respectively (see Figure 4 for definitions). (A) Top: color plot showing movement parameter aligned to inhalation onset for within-trial sniffs taken before crossing the decision line. Taken from one mouse, one behavioral session. Dotted line at time 0 shows inhalation onset, the second line demarcates the end of the sniff cycle, sorted by duration. Data are taken from one behavioral session. Middle: color plot showing each movement parameter aligned to inhalation onset for inter-trial interval sniffs taken before the first attempt at premature trial initiation. Bottom: sniff-aligned average of each movement parameter. Thin lines represent individual mice (n = 11), bolded lines and shaded regions represent the grand mean ± standard deviation. Green: within-trial sniffs; pink: inter-trial interval sniffs. (B) Normalized cross-correlation between movement parameter and sniff signal for the same sniffs as above. (C) Spectral coherence of movement parameter and sniff signal for the same sniffs as above.


