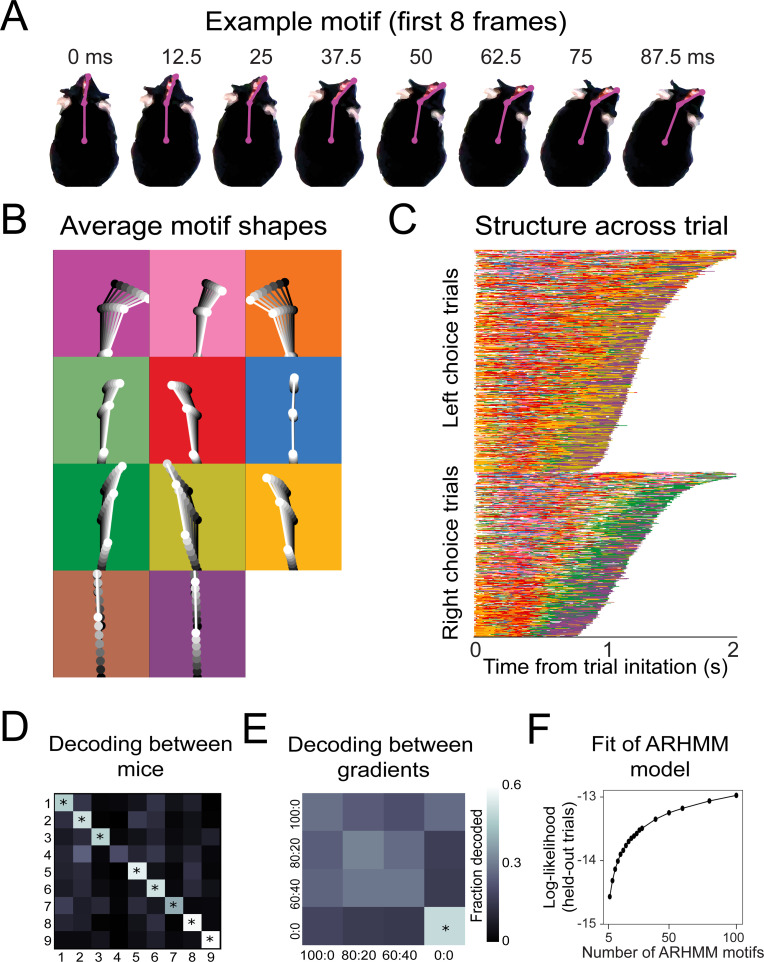
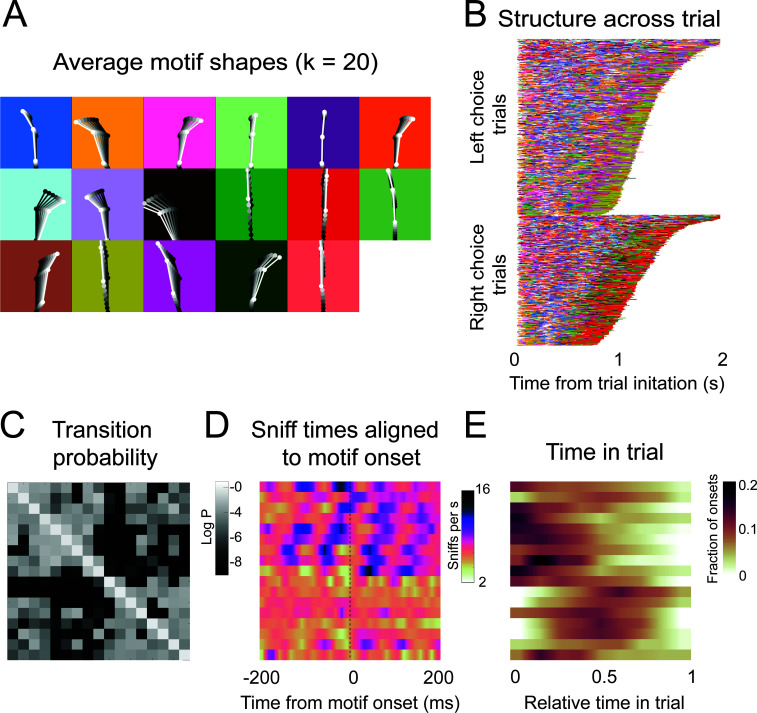
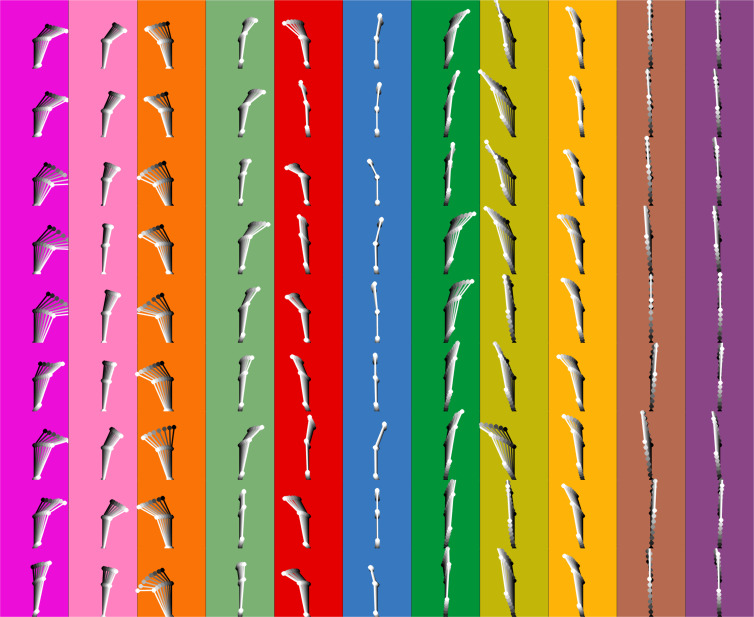
Figure 6. Recurring movement motifs are sequenced diversely across mice and consistently across stimuli.
(A) Eight example frames from one instance of a behavioral motif with tracking overlaid. (B) Average motif shapes. Dots and lines show the average time course of posture for eight frames of each of the 11 motifs (n = 9 mice). All instances of each motif are translated and rotated so that the head is centered and the head-body axis is oriented upward in the first frame. Subsequent frames of each instance are translated and rotated the same as the first frame. Time is indicated by color (dark to light). Background color in each panel shows the color assigned to each motif. (C) Across-trial motif sequences for two behavioral sessions for one mouse. Trials are separated into trials where the mouse chose left and those in which the mouse chose right. Trials are sorted by duration. Both correct and incorrect trials are included. Color scheme as in (B). (D) Linear classifier analysis shows that mice can be identified from motif sequences on a trial-by-trial basis. Grayscale represents the fraction of trials from a given mouse (rows) that are decoded as belonging the data of a given mouse (columns). The diagonal cells represent the accuracy with which the decoded label matched the true label, while off-diagonal cells represent trials that were mislabeled by the classifier. Probabilities along rows sum to 1. Cells marked with asterisks indicate above chance performance (label permutation test, p<0.01). (E) Linear classifier analysis identifies odor omission trials above chance, but does not discriminate across odor concentration ratios (n = 9 mice). (F) Cross-validated log-likelihood (evaluated on trials not used for model fitting) for fit auto-regressive hidden Markov model (AR-HMM) models with different numbers of motifs, S, shows that model log-likelihood does not peak or plateau up to S = 100.

