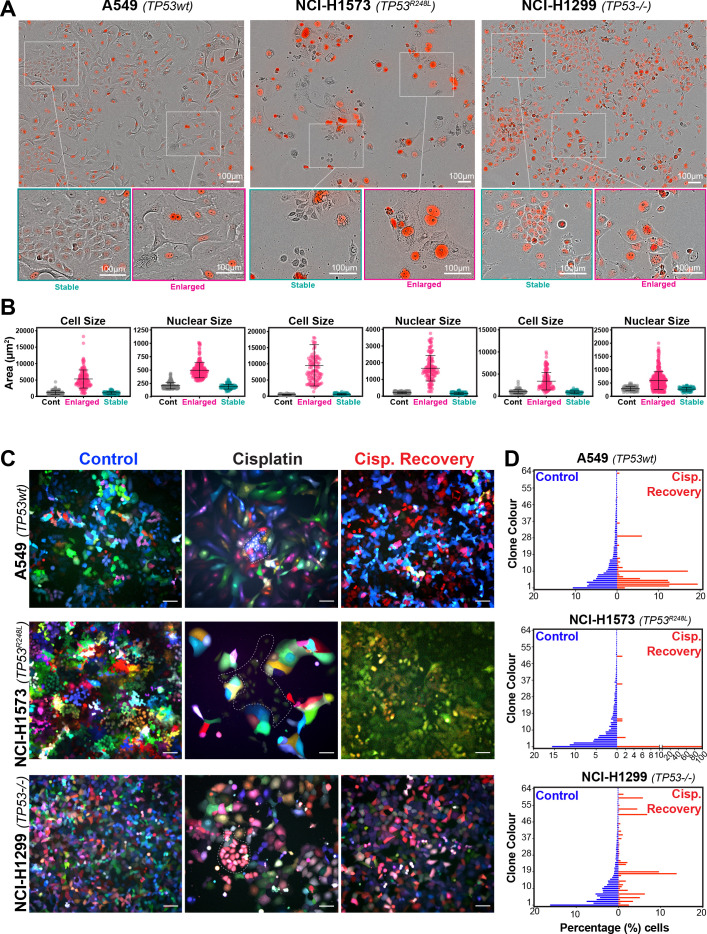
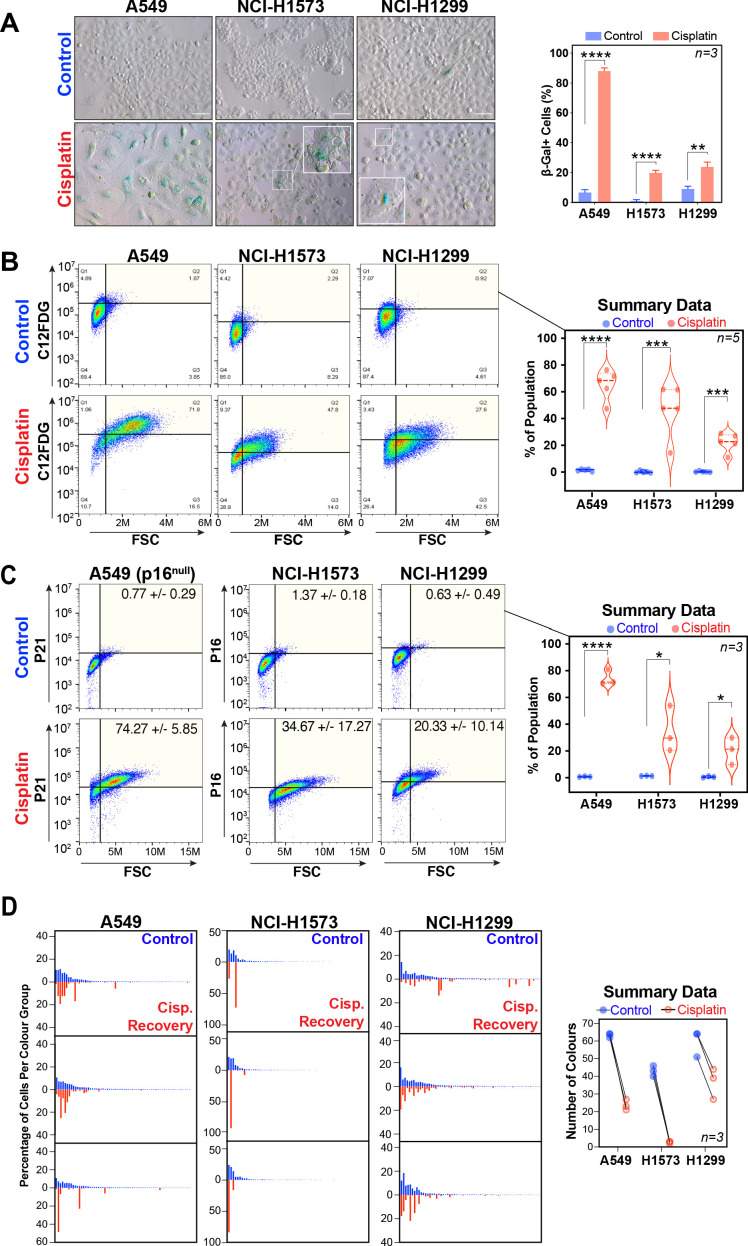
Figure 2. Variable cell size and clonal outgrowth in post-cisplatin-treated cells.
(A) Representative images from cells treated as per Figure 1A showing control (Cont.), proliferative (Prolif.), and arrested (Arrest) cells. Scale bars = 100 µm. (B) Cell and nuclear size were calculated on sub-populations of cells that appeared to form clonal outgrowths. Quantification of cell size and nuclear size from (A), with a minimum of n = 100 cells analysed per condition. Shown are the mean ± SD. Statistical significance was determined by one-way ANOVA (****p<0.0001, n.s = not significant). (C) LeGO RGB colour-guided clonal cell tracking system was used to track clonal dynamics after cisplatin pulse treatment. Cells were treated as per Figure 1A, with clonal identification and quantification (D), measured at 3 and 21 days post-cisplatin exposure using Image J/Fiji (42 days post-cisplatin exposure for NCI-H1573).


