. 2021 May 13;10:e65234. doi: 10.7554/eLife.65234

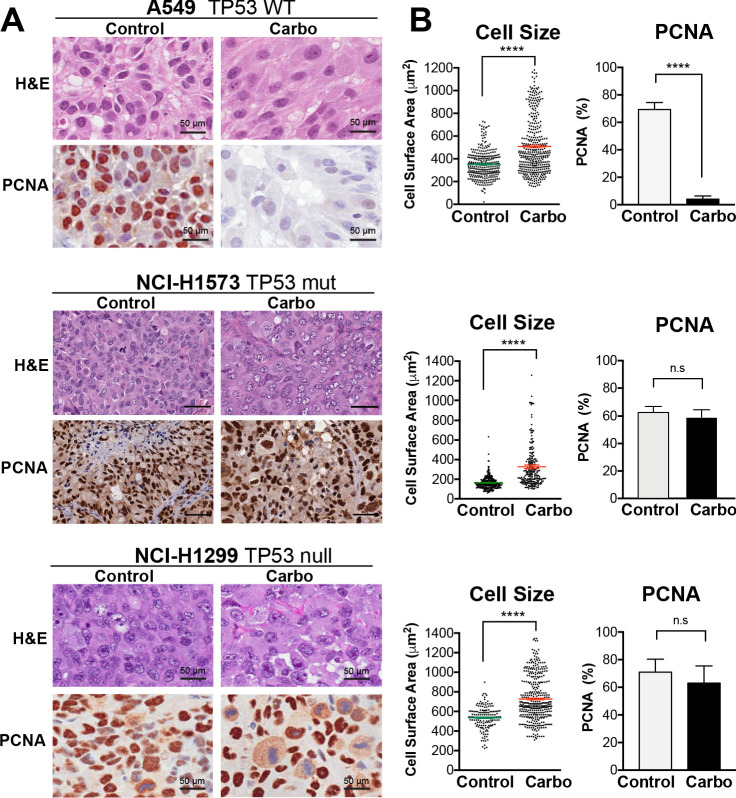
Figure 3. In vivo validation of cisplatin effects on cell size and proliferation.

(A) A549 and NCI-H1299 cells were injected subcutaneously with 2 × 10⁶ cells into the flanks of nude mice (n = 5). Carboplatin (60 mg/kg) was delivered by a single tail-vein injection, and tumours were harvested at 3 days post treatment and analysed by IHC for cell size and PCNA-positive staining. Scale bar = 50 µm. (B) Quantification of IHC images from (A) (control n = 300, carbo n = 400). Shown are the mean ± SD. Statistical significance was determined by unpaired two-tailed Students t-test (****p<0.0001, n.s = not significant).

Figure 3.

Figure 3—figure supplement 1. Cells were pulsed cisplatin or not (0 hr) for 2 hr and then with BrdU for 2 hr prior to harvesting at the indicated timepoints.

Figure 3—figure supplement 1.

Cells were counter-stained with PI with DNA content and BrdU staining analysed by flow cytometry to identify cells in G1 (BrdU negative, 2 n DNA content; active S phase = between 2n and 4n) DNA and positive for BrdU, inactive S phase = 2n–4n DNA content and negative for BrdU; G2/M = 4n DNA content. The percentage of cells ± standard deviation for each population from (n = 3) independent repeats is shown.