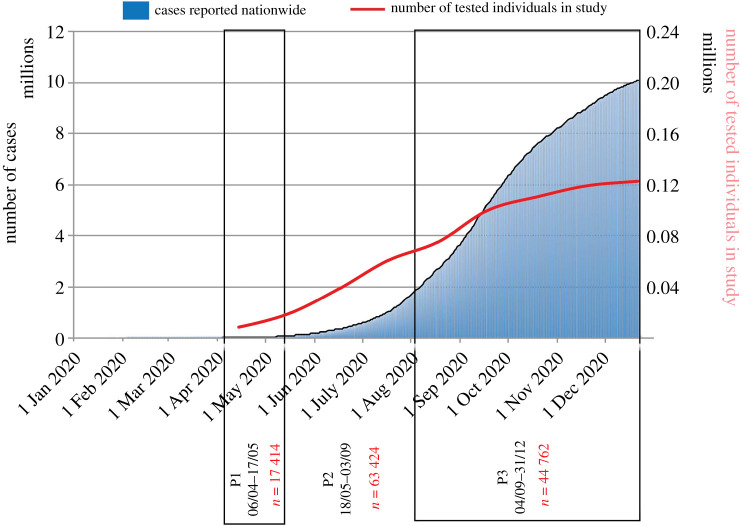
Figure 1.
Cumulative COVID-19 positive cases since the first case on 30 January 2020 nationwide. The portion of the histogram shows the policy change dates for COVID-19 (P1: 06/04–17/05; P2: 18/05–03/09; P3: 04/09–31/12). The blue line on the graph represents daily positive cases (moving average). Data for COVID-19 were adapted from the World Health Organization Coronavirus Disease Dashboard. The red line on the graph represents the cumulative suspected number of cases from the database from the current study. Policy changes in different time periods were: P1—all symptomatic patients with international travel history, contacts with positive cases, and healthcare workers managing COVID-19 positive patients to be tested; P2—in addition to P1, all healthcare/frontline workers involved in containment and mitigation of COVID-19, all hospitalized patients who developed ILI symptoms, and all symptomatic among returnees and migrants within 7 days of illness to be tested; P3—routine surveillance in containment by rapid diagnostic tests, exposed and asymptomatic, symptomatic patients and high-risk patients (those requiring hospitalization with co-morbidities/elderlies ≥ 65 years/immunocompromised/pregnant females) to be tested by molecular techniques, and it also allowed self-referrals.

