
Figure 4.
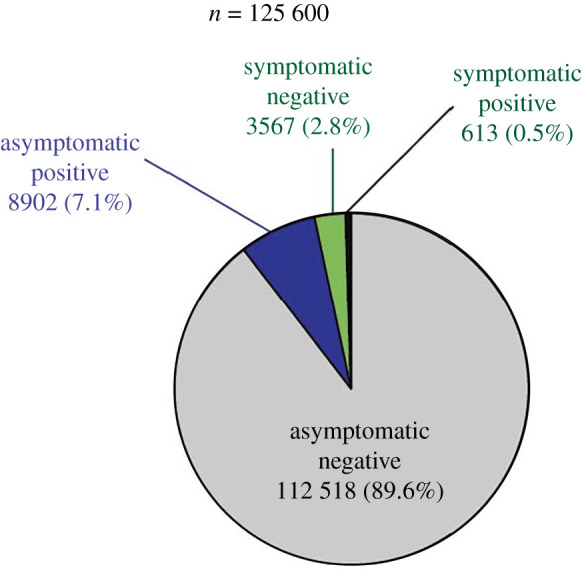
Distribution of a total number of individuals tested for SARS-CoV-2 (n = 125 600). The pie-chart shows the distribution of individuals tested, and the positives and negatives for SARS-CoV-2 along with symptom status.
Official websites use .gov
A
.gov website belongs to an official
government organization in the United States.
Secure .gov websites use HTTPS
A lock (
) or https:// means you've safely
connected to the .gov website. Share sensitive
information only on official, secure websites.
Distribution of a total number of individuals tested for SARS-CoV-2 (n = 125 600). The pie-chart shows the distribution of individuals tested, and the positives and negatives for SARS-CoV-2 along with symptom status.