Figure 2.
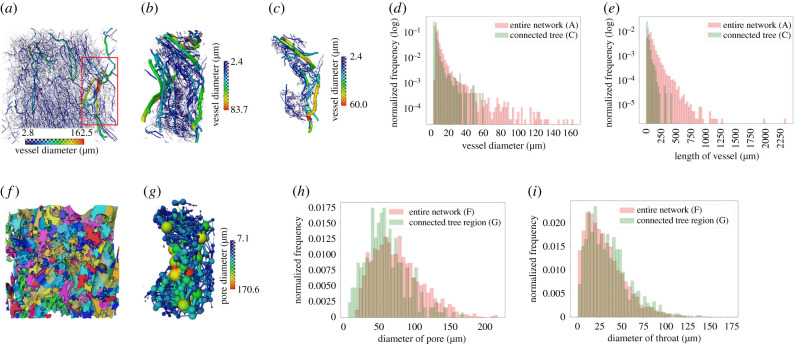
Three-dimensional analysis of the structure of the fetal vascular network and maternal porous space (Specimen 1, normal placenta at term). (a,b) Skeletonized vascular structure from the entire tissue volume and from a small cropped region (the red box in a). (c) A single connected vascular tree in the cropped region shown in (b). (d,e) Distributions of vessel diameter and length of blood vessels from the entire fetal vascular network and the connected vascular tree shown in (a) and (c), respectively. (f) Porous regions in the central tissue region (approx. 1.8 mm3). The colours represent different porous regions but are not related to the sizes of the pores. (g) Ball and stick model to represent pores and throats in the cropped region as in (c). (h,i) Distributions of diameters of porous regions and connecting throats in the central tissue region and the region that encompasses the single connected tree in (c).

