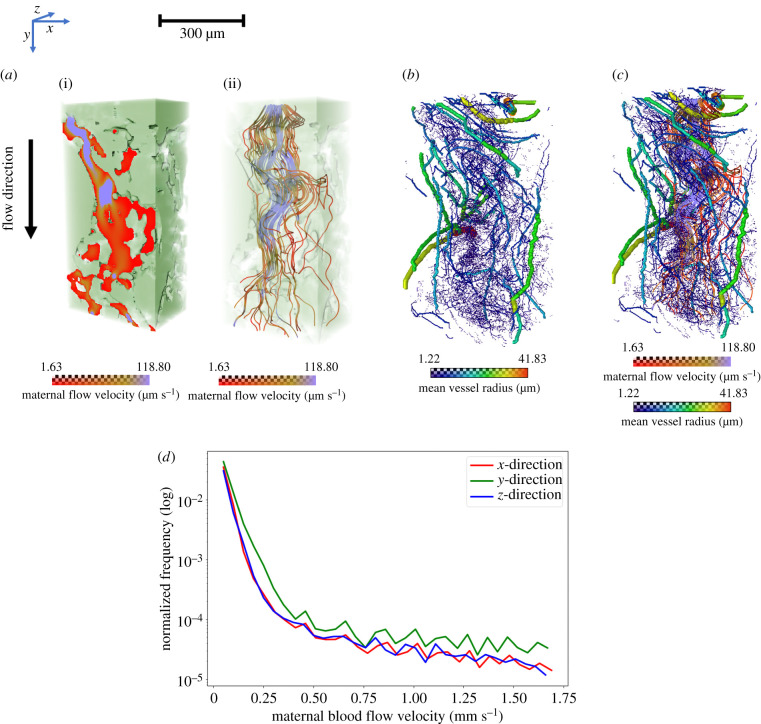
Figure 3.
Flow simulations across maternal IVS to visualize the inter-relationship between maternal blood flow and fetal vascular flow (Specimen 1, normal placenta at term). (a) The maternal (i) flow velocity map and (ii) flow streamlines in the IVS. (b,c) The inter-relationship of maternal flow streamlines and fetal blood vascular network. (d) Line graphs comparing the maternal blood flow velocity distributions in three different directions with a fixed pressure gradient. The x-axis of the graph shows maternal blood flow velocity and y-axis shows the normalized frequency in logarithmic values.

