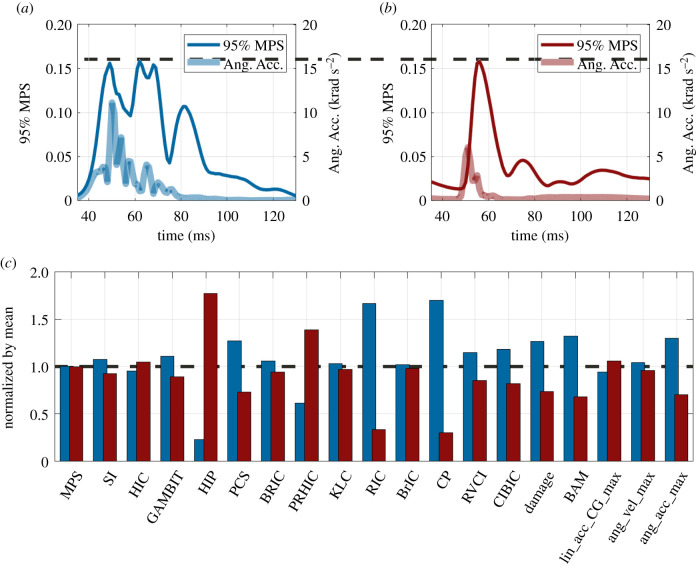
Figure 1.
Comparison between two impacts in college football (a) and in mixed martial arts (b). The traces of 95% MPS (left axis) and angular acceleration (Ang. Acc., right axis) magnitudes are plotted in (a,b), and these two impacts have the same peak value of 95% MPS as shown by the dashed line across (a) and (b). The 95% MPS peak value and BIC values are given in (c). The blue and red bars indicate college football and mixed martial arts, respectively. The information of BIC is introduced in §2.2.

