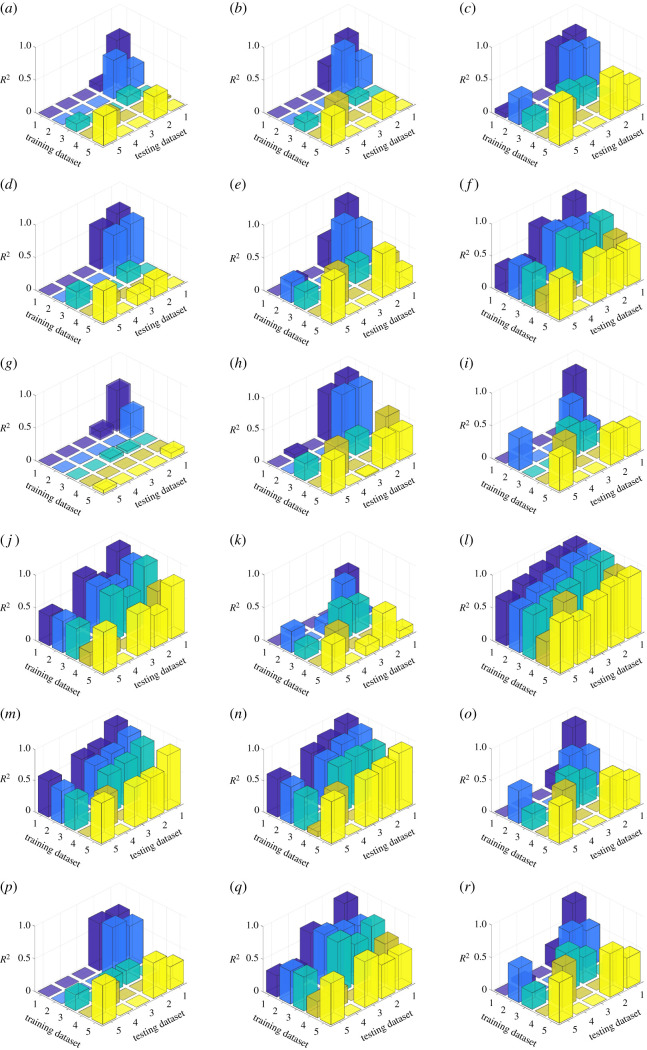
Figure 4.
The mean R2 in the single-dataset regression and cross-dataset regression of MPS95 based on 18 BIC with 100 iterations of bootstrapping resampling. The colour indicates the same training dataset. Dataset 1, laboratory impacts; dataset 2, college football; dataset 3, MMA; dataset 4, NHTSA; dataset 5, NASCAR. (a) SI, (b) HIC, (c) GAMBIT, (d) HIP, (e) PCS, (f) BRIC, (g) PRHIC, (h) KLC, (i) RIC, (j) BrIC, (k) CP, (l) RVCI, (m) CIBIC, (n) damage, (o) BAM, (p) lin_acc_CG_max, (q) ang_vel_max and (r) ang_acc_max.

