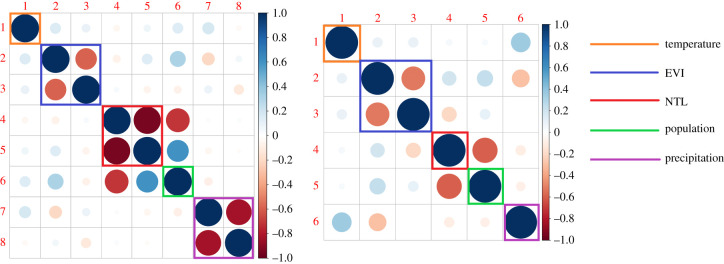
Figure 3.
Correlations for the regression parameter estimators. The left panel corresponds to the model that uses the linear splines as indicated by the red dashed lines of figure 2. The right panel corresponds to the model obtained by removing one knot for the population and precipitation covariates, as indicated by the green dashed lines of figure 2.

