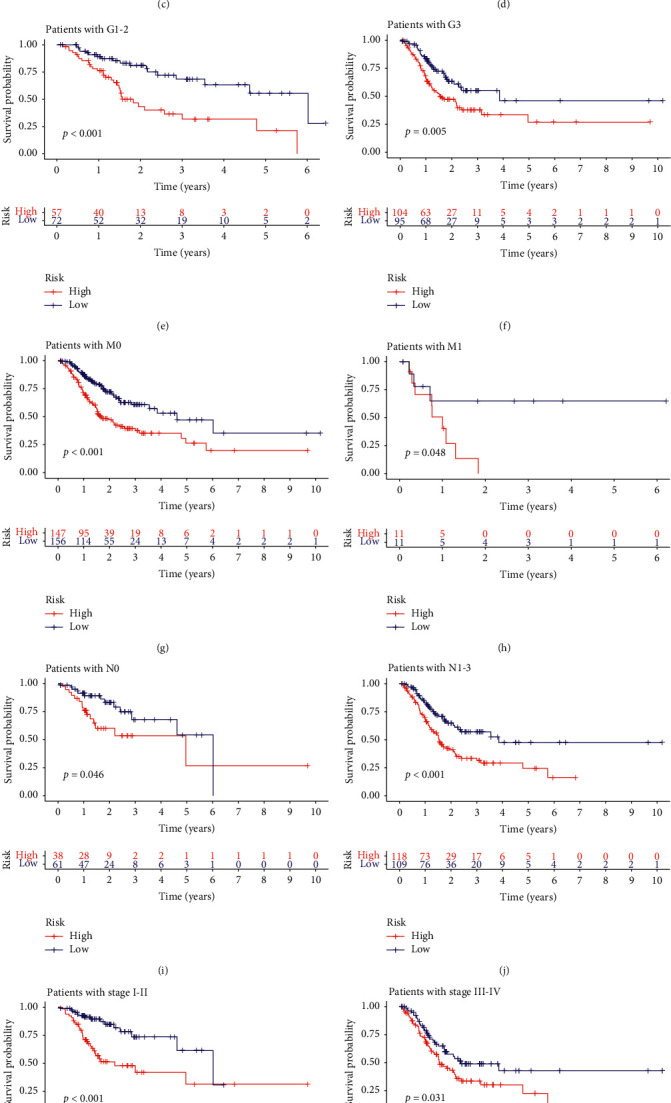
Figure 6.

Model validation for clinical subgroups. The samples were grouped by age, sex, metastasis, stage, and lymph node infiltration. The red curve represents the high-risk group and the blue curve represents the low-risk group. The Cox proportional hazards regression model showed good predictive ability in each clinical subgroup. All of the results were statistically significant.
