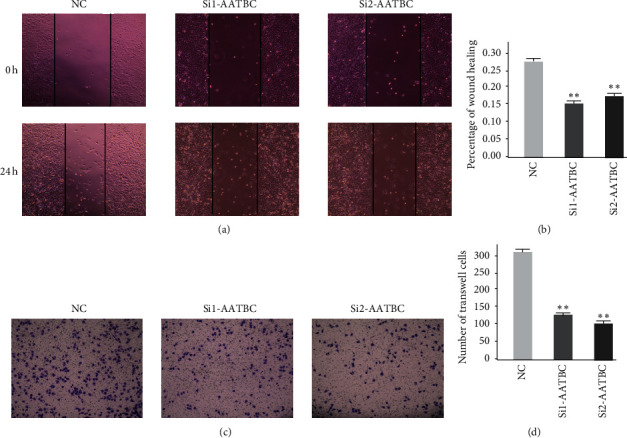
Figure 7.

AATBC-related cell experiments. (a) The cell migration results of the normal control group, the SiRNA1 group, and the SiRNA2 group were observed under the microscope at 0 h and 24 h. (b) The results of wound healing assay were expressed as the mean ± SD of the three independent experiments (∗∗P < 0.01). (c) Transwell assay was used to compare the normal control group, the SiRNA1 group, and the SiRNA2 group. AATBC knockdown was observed to inhibit cell migration. (d) The results of transwell assay were expressed as the mean ± SD of the three independent experiments (∗∗P < 0.01).
