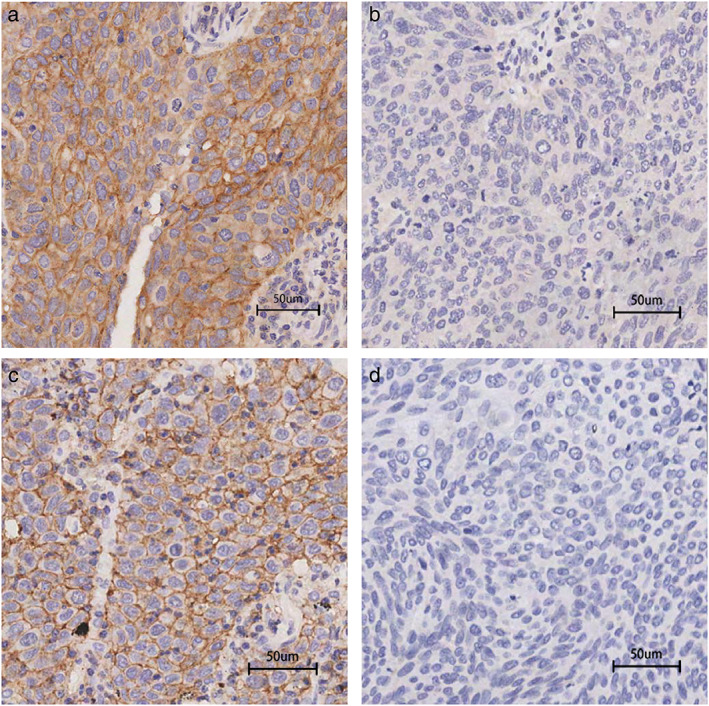
FIGURE 1.

Representative images of immunohistochemical staining for PD‐L1 and CD47. (a) Positive membrane staining for PD‐L1. (b) Negative membrane staining for PD‐L1. (c) Positive membrane staining for CD47. (d) Negative membrane staining for CD47. Scale bar: 50 μm. PD‐L1, programmed cell death‐ligand 1; CD47, cluster of differentiation 47
