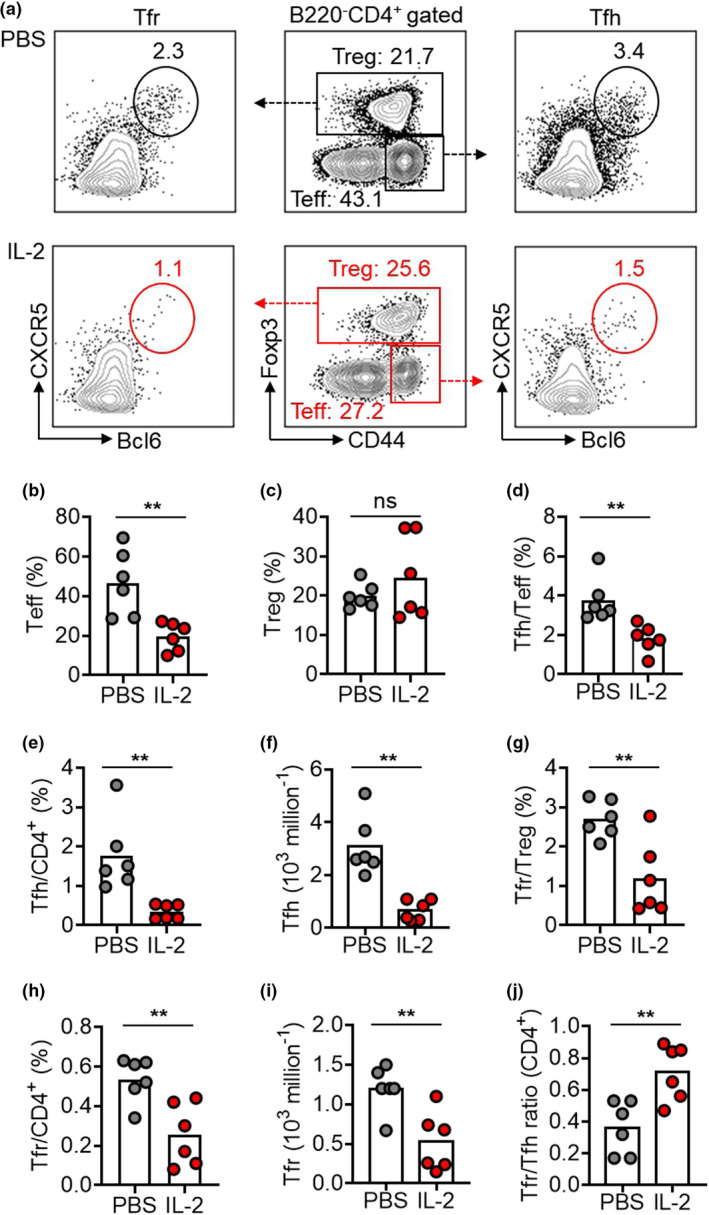
Figure 3.

28‐day low‐dose IL‐2 therapy inhibited Tfr cells but upregulated the Tfr/Tfh ratio in NZB/W F1 mice. (a–j) Representative FACS plots (a) and statistics showing Teff cells (b), Treg (c), Tfh cells in Teff cells (d), Tfh cells in CD4+ T cells (e), the numbers of Tfh cells (f), Tfr cells in Treg cells (g), Tfr cells in CD4+ T cells (h), the numbers of Tfr cells (i) and the ratio of Tfr/Tfh cells (CD4+) (j) in spleens of NZB/W F1 mice with long treatment regimen of low‐dose IL‐2 or PBS with every second day for 28 days. Data are shown for individual (dots, n = 6) and mean (bars) values. Data are representative of three independent experiments and analysed by the Student's unpaired t‐test or the Mann–Whitney U‐test. **P < 0.01. NZB/W F1, F1 hybrid between the New Zealand Black (NZB) and New Zealand White (NZW) strains; Teff, effector T cell; Tfh, T follicular helper cell; Tfr, T follicular regulatory cell; Treg, regulatory T cell.
