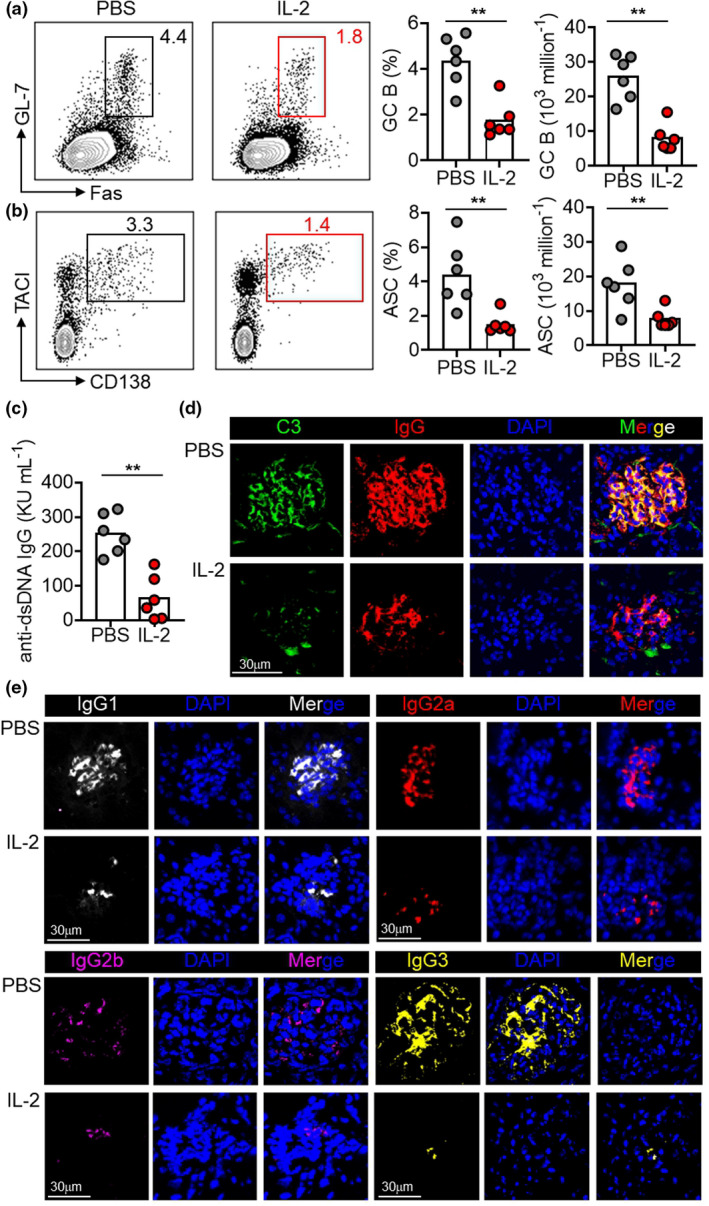
Figure 4.

28‐day low‐dose IL‐2 therapy attenuated pathogenic humoral immunity. (a, b) Representative FACS plots and statistics showing the ratio and cell numbers of GC B cells (a) and ASCs (b) in spleens of NZB/W F1 mice with long treatment regimen of low‐dose IL‐2 or PBS with every second day for 28 days. (c) ELISA measurement of anti‐dsDNA IgG titre in the serum of NZB/W F1 mice with PBS or IL‐2 treatment. (d, e) Immunofluorescence staining of deposits C3 (green), IgG (red) (d), IgG1 (white), IgG2a (red), IgG2b (pink) and IgG3 (yellow) (e) in kidneys of NZB/W F1 mice with PBS or IL‐2 treatment. Nucleus were stained with DAPI (blue). Scale bar: 30 μm. Data are shown for individual (dots, n = 6) and mean (bars) values. Data are representative of three independent experiments and analysed by the Student's unpaired t‐test or the Mann–Whitney U‐test. **P < 0.01. ASC, antibody‐secreting cell; C3, complement component 3; GC, germinal centre; and NZB/W F1, F1 hybrid between the New Zealand Black (NZB) and New Zealand White (NZW) strains.
