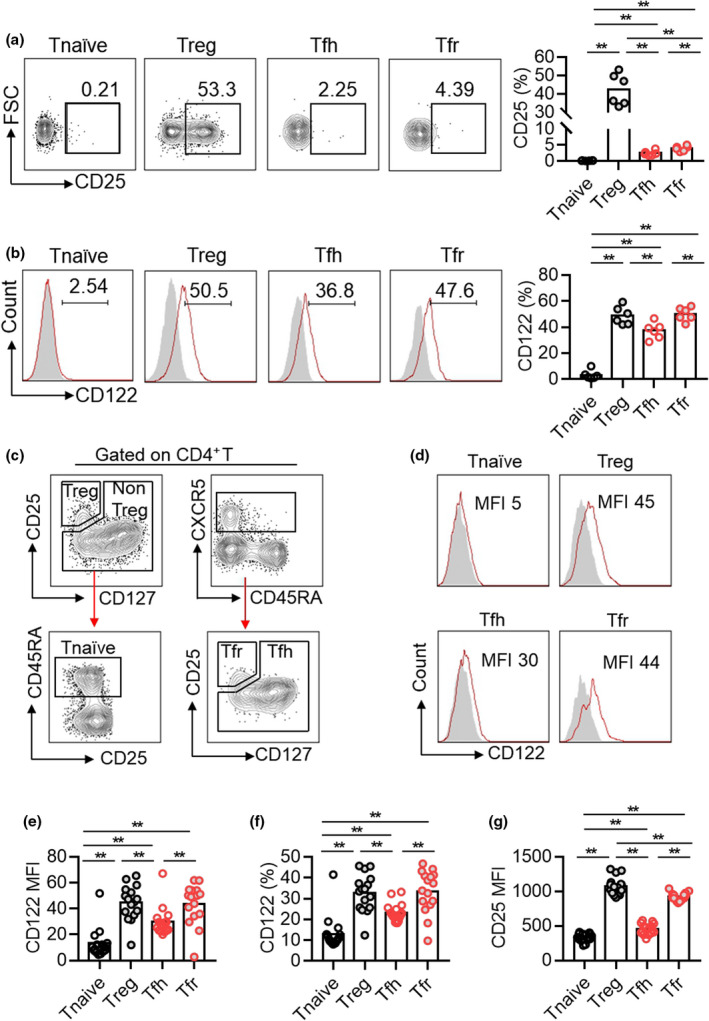
Figure 7.

Flow cytometric analysis of CD25 and CD122 expressions in Tnaive, Treg, Tfh and Tfr cells in spleens of NZB/W F1 mice and in PBMC of SLE patients. (a, b) Representative dot plots and percentage statistics of CD25 (a) and CD122 (b) expressions in Tnaive (B220−CD4+CD44−CD62L+), Treg (B220−CD4+Foxp3+), Tfh (B220−CD4+CD44+CXCR5+BCL6+) and Tfr (B220−CD4+Foxp3+CXCR5+BCL6+) cells in spleens of 5‐month‐old NZB/W F1 mice. Data are shown for individual (dots, n = 6). Data are representative of three independent experiments. (c–g) Representative dot plots and the statistics of the median fluorescence index (MFI) of CD122 (e), the frequency of CD122 positive portion (f) and the median fluorescence index (MFI) of CD25 (g) among Tnaive (CD3+CD4+CD25−CD45RA+), Treg (CD3+CD4+CD25+CD127−), Tfh (CD3+CD4+CXCR5+CD25−) and Tfr (CD3+CD4+CXCR5+CD25+CD127−) cells in PBMC from SLE patients. Data are shown for individual (dots, n = 16) and mean (bars) values and analysed by one‐way ANOVA followed by the post hoc Tukey test. **P < 0.01.
