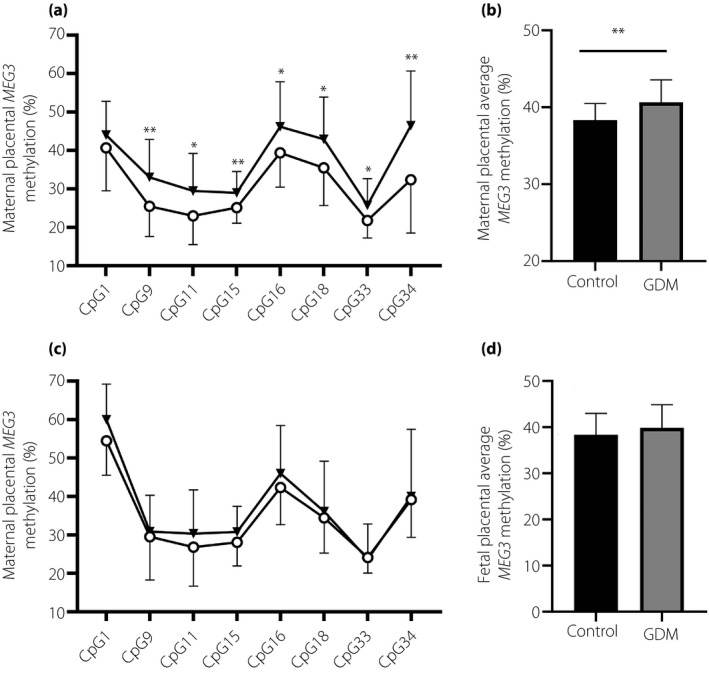
Figure 2.

Comparison of maternally expressed gene 3 (MEG3) deoxyribonucleic acid methylation levels in gestational diabetes mellitus (GDM; n = 23) and control (n = 23) placentas. (a,b) Methylation status of MEG3 differentially methylated region (DMR) on the maternal side, including the (a) mean MEG3 methylation level and (b) specific individual CpG sites. (c,d) MEG3‐DMR methylation status on the fetal side, including the (c) mean MEG3 methylation level and (d) specific individual CpG sites. GDM and the control group are indicated by triangles (▼) and circles (○), respectively. Data are presented as the mean ± standard error; *P < 0.05; **P < 0.01.
