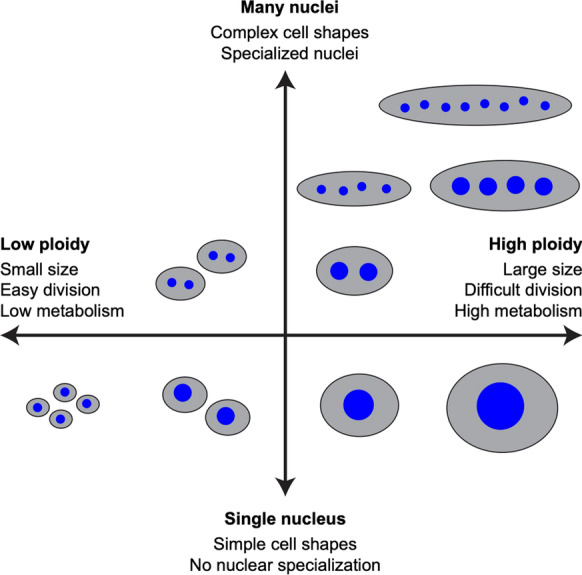
Fig. 2.

Ploidy and multinucleation. Axes showing changing cellular properties based on a spectrum from low to high ploidy and nuclear number. “High” and “low” ploidy are kept intentionally vague in this figure, as cell-type-specific biology may impact the properties listed
